
Ice Caps and Sea Levels as an Indicator of Global Climate Change
About This Module
Topics: Climate, Greenhouse Gases, CO2 -driven Changes, Ice Caps, Ocean Sea Levels
Grade Levels: 9-12
Scenario
Today’s high school students were not born in 1978. This must seem like a long time ago, but yet scientists were already predicting that global warming would eventually lead to a disintegration of Earth’s polar ice caps and shelves. They also warned that the melting of the world’s ice caps would have far-reaching effects—far beyond a mere loss of ice in places where most of you will never travel.
 http://www.nrdc.org/globalWarming/qthinice.asp") In 1978 scientists were putting together climate models based on historical data and emerging technological advances such as new satellite data. They continued to gather data, to create new technologies, and to discover more about the complicated mechanisms of ice masses.
In 1978 scientists were putting together climate models based on historical data and emerging technological advances such as new satellite data. They continued to gather data, to create new technologies, and to discover more about the complicated mechanisms of ice masses.
New spaceborne data, research data gathered in the polar regions, and climate models indicate that the 1978 prediction might be coming true. And it might be unstoppable.
The Pine Island Glacier in West Antarctica is losing ice four times faster than it was a decade ago. Numerous ice shelves in the Antarctic and Arctic collapse and drift out to sea. The Larsen A ice shelf disintegrated in 1995; the Larsen B ice shelf disintegrated in 2002. After being stable for nearly 12,000 years, the Larsen B ice shelf disappeared in a single season.
In the Arctic region temperatures are rising twice as fast as elsewhere in the world. Ice is thinning, melting, and collapsing into the sea. The largest block of ice in the Arctic, the Ward Hunt ice shelf, started to crack in 2000. Within two years it had split all the way through. The Arctic polar ice cap is contracting at a rate of 9 percent per decade. At this rate Arctic summers could be ice free by the end of this century.
The consequences of the loss of Earth’s ice sheets and shelves are far-reaching. New studies examine how the disintegration of ice sheets could result in a rise in global sea levels. Other research attempts to estimate the level of rise should particular ice sheets disintegrate and melt in open ocean waters. Satellite images of more than 200 glaciers on the Antarctic Peninsula showed that they were melting approximately 12 percent faster in 2003 than they were in 1993.
The melting in the Arctic, for example, will affect natural ecosystems of polar bears, whales, and seals. It will change migration patterns and adversely affect the native people who depend on the ecosystem.

Without the cooling effect of the layers of ice, Earth will absorb more sunlight, and temperatures will warm even more. Increased temperatures will produce faster melting, which will contribute to sea level rise, threaten low-lying areas around the globe, cause coastal flooding, and contaminate freshwater supplies. Scientists now predict a 3-foot sea rise by 2100. This would flood approximately 22,400 square miles along the Atlantic and Gulf coasts of the United States.
“Warming Arctic Affects Wheat in Kansas.” That headline would be a lot closer to home, wouldn’t it? If Kansas becomes 4 degrees warmer in the winter without Arctic ice, which creates cold air masses that slide southward, wheat farmers wouldn’t have the needed freezing temperatures to grow winter wheat. And warmer summer days would mean 10 percent less moisture in Kansas cropland soils.
Scientists continue to measure, study, and research this complicated topic in order to better predict possible changes. They also look to future strategies for remediation of the problems and important solutions to complex predicaments.
Task: Ice Caps and Sea Levels
As a research scientist working for the U.S. Panel on Global Climate Change Research, you and your colleagues have been collecting data in the field for months. Research on varying aspects of Earth’s diverse ecosystems has been studied, and your colleagues are just now gathering to share their experiences and their preliminary findings with the rest of the group.
Your fellow scientists are also friends. They are returning from Earth’s deserts, where they monitored temperature ranges, and from the world’s oceans after charting sea surface temperatures, ocean currents, and deepwater organisms. Plants and animals have been studied for possible global climate effects. Researchers in the rainforest have tracked species diversity. Epidemiologists have concentrated on human health in an effort to improve health conditions for Earth’s human inhabitants.
You are glad to see them, but everyone knows what a huge task lies ahead. With a major international conference looming, it’s time for all of you to analyze the data to formulate a comprehensive report on global climate change on Earth.
This conference requires more than a standard report presenting data and displaying results in tables and graphs. Analysis of the data will be required to fully present an accurate picture of the state of the planet’s climate and trends that have been the focus of heated controversy and debate for the last decade. As a scientist, you naturally look at the data from purely objective perspectives.
You have been part of a team of scientists studying changes in Earth’s ice caps and rising sea levels. Your team gathers to begin work on analyzing its research in order to answer questions for the upcoming conference. Some of those questions will include:
- What changes have been occurring with Earth’s important ice caps?
- What role does global warming seem to have on the ice sheets and sea levels?
- What are some of the predictions for the future if these trends continue?
- What are some of the consequences?
Sample Rubrics
The developing rubrics page in the Problem Based Learning section provides a content-specific rubric for the Ice Caps and Sea Levels module under the Sample Rubrics heading.
Skill Building Activities
The following activites can be used to help your students learn how they can use NASA satellite data resources to solve the problem-based learning task presented.
Title: Ocean Currents and Sea Surface Temperature
Estimated time for completing activity: 50 minutes
Learning outcomes for this activity:
- Know how differential heating of Earth results in circulation patterns in the atmosphere and oceans that globally distribute the heat.
- Know the relationship between the rotation of Earth and the circular motions of the ocean currents and air pressure centers.
- Make predictions by linking current scientific satellite data concerns about global climate change.
- Produce graphs using graphing software.
- Observe graphical changes in parameters.
- Identify relationships between parameters.
- Make and defend conclusions based on evidence.
- Understand how calculations can be performed on data expressed as maps, such as averaging or subtracting.
- Observe changes in snow and ice over a 10-year period and draw conclusions about trends indicated by the observations.
Title: Evidence of Change Near the Arctic Circle
Estimated time for completing activity: 50 minutes
Learning outcomes for this activity:
- Produce graphs using graphing software.
- Observe graphical changes in parameters.
- Identify relationships between parameters.
- Make and defend conclusions based on evidence.
Title: Studying Snow and Ice Changes
Estimated Time for Completing Activity: 1-2 periods
Learning outcomes for this activity:
- Understand how calculations can be performed on data expressed as maps, such as averaging or subtracting.
- Observe changes in snow and ice over a 10-year period and draw conclusions about trends indicated by the observations.
Learning Objectives
Alignment of Learning Objectives and Standards: Ice Caps and Sea Levels as Key Indicators
|
Learning Objective |
National Science Content Standard Grades 9—12 |
West Virginia State Science Standard Grades 9—12 |
|
|
Apply research skills to locate relevant data on an environmental issue. |
2e |
A—Science as Inquiry
|
CS: 1—Nature of Science CS: 2—Content of Science—Conceptual Biology CS: 3—Application of Science |
|
Analyze data to identify trends occurring in ice caps and sea levels. |
2e |
A—Science as Inquiry E—Science and Technology |
CS: 1—Nature of Science CS: 2—Content of Science—Conceptual Biology Biology CS: 3—Application of Science |
|
Use scientific data to support a position on ice caps and sea levels as an environmental issue. |
4e 4f |
A—Science as Inquiry E—Science and Technology |
CS: 1—Nature of Science CS: 2—Content of Science—Conceptual Biology CS: 3—Application of Science |
|
Explain the impacts of changes in ice caps and sea levels. |
|
C—Life Science F—Science in Personal and Social Perspectives |
CS: 2—Content of Science—Physical Science Environmental Science |
|
Describe underlying environmental mechanisms that drive ice caps and sea level trends. |
2a 2b |
C—Life Science D—Earth and Space Science |
CS: 2—Content of Science—Environmental Science Earth Science |
|
Find sources for changes affecting Earth’s ice and connect to related variables. |
7a |
C—Life Science
|
CS: 2—Content of Science—Environmental Science Earth Science Biology |
|
Identify anthropogenic sources of observed changes in ice mass and sea levels. |
|
C—Life Science
|
CS: 2—Content of Science—Environmental Science Earth Science |
|
Explain possible human consequences to predicted global climate change. |
2b 7a |
C—Life Science F—Science in Personal and Social Perspectives |
CS: 2—Content of Science—Environmental Science |
|
Distinguish between types of ice mass formations on Earth, i.e., ice caps, ice shelves, glaciers. |
|
D—Earth and Space Science |
CS: 2—Content of Science— |
|
Describe how ice loss will affect natural ecosystems, migration routes, and weather patterns. |
7a 7b |
C—Life Science F—Science in Personal and Social Perspectives |
CS: 2—Content of Science— Environmental Science Conceptual Biology Biology |
|
Make predictions for the future if trends continue. |
7b |
C—Life Science F—Science in Personal and Social Perspectives |
CS: 2—Content of Science— Environmental Science Biology |
Featured Data
Go to Ice Caps and Sea Levels Featured Data ![]()
Ice Caps and Sea Levels
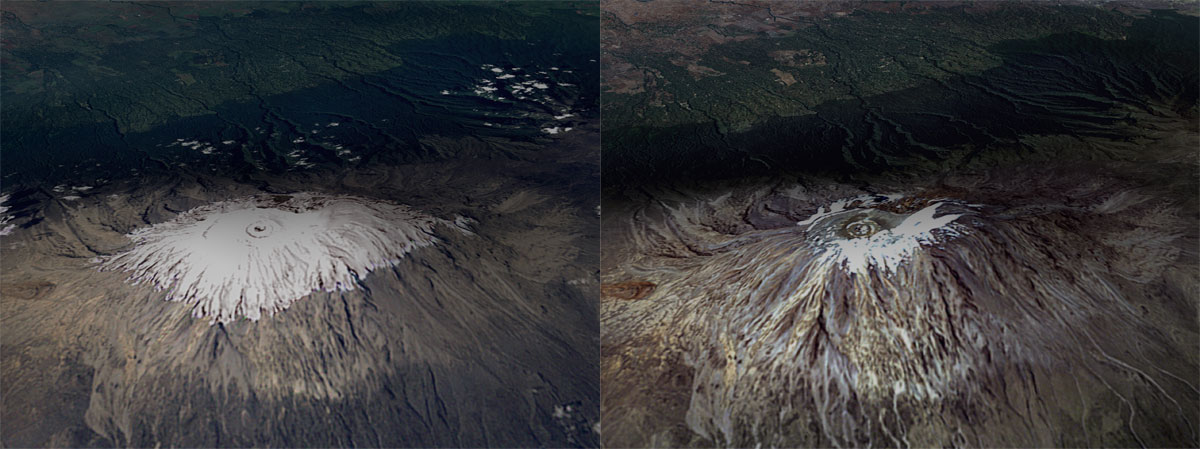
Left: Feb. 17, 1993. Right: Feb. 21, 2000.
Kilimanjaro is the tallest freestanding mountain in the world and is made up of three volcanic cones. These before and after images show the dramatic decline in Kilimanjaro's icecap over recent decades.
Credit: Images taken by the NASA/USGS Landsat satellite. Courtesy Jim Williams, NASA GSFC Scientific Visualization Studio, and the Landsat 7 Science Team.
Muir Glacier
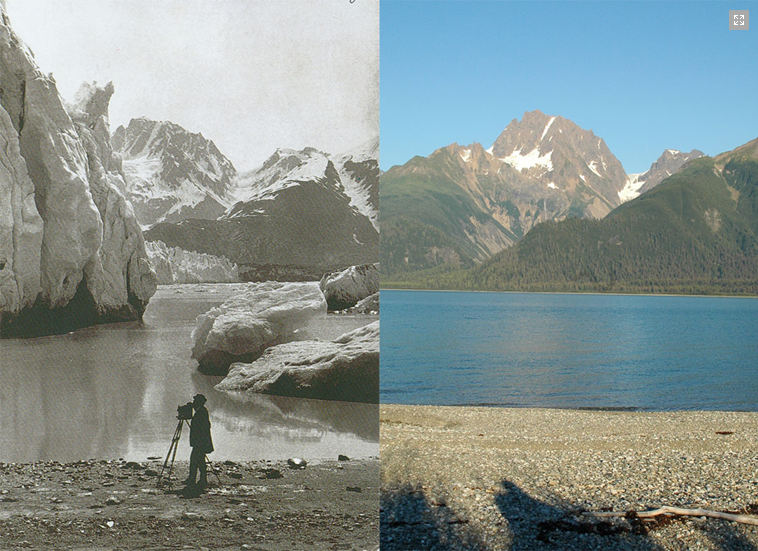
Left: 1891. Right: 2005.
Credit: Photographed by G. D. Hazard in 1891 and by Bruce F. Molnia in 2005.
Credit: The Glacier Photograph Collection. Boulder, CO, and the National Snow and Ice Data Center/World Data Center for Glaciology.
Larsen B Ice Shelf Collapse—Size Comparison
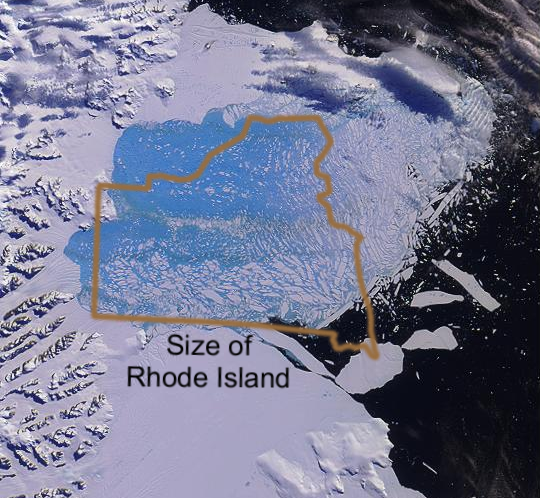
A satellite image shows the 2002 breakup of the Larson B ice shelf in comparison to the size of the state of Rhode Island. The light blue color is a false color enhancement showing the region of breakup based on apparent temperature differences (measured in infrared wavelengths) of ocean water versus water previously under the ice shelf.
This image is based off NASA Terra/MODIS imagery, which belongs to the public domain. Global warming art site: http://www.globalwarmingart.com/wiki/File:Bear_Glacier_jpg
Projected Changes in Sea Ice Thickness (1950-2050)
Credit: This image is a work of the National Oceanic and Atmospheric Administration, taken or made during the course of an employee's official duties. As works of the United States, all NOAA images are in the public domain.
Sea Level Rise
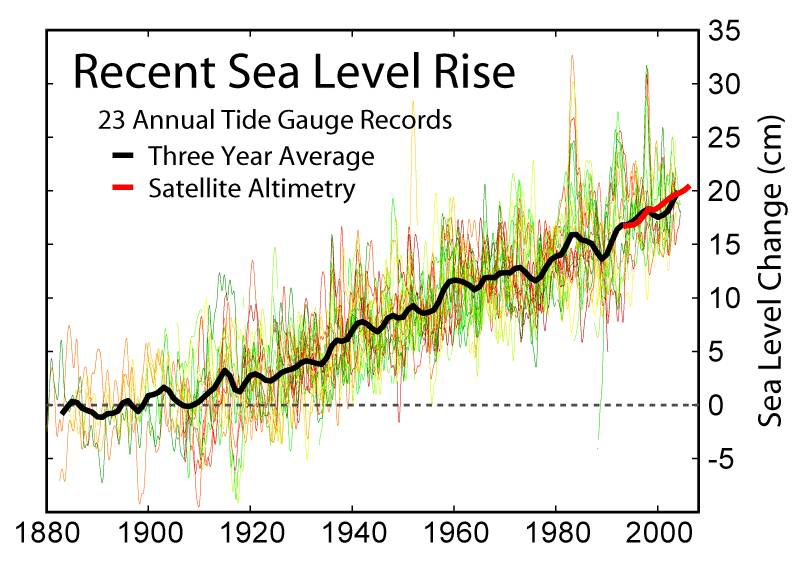
Sea level measurements from 23 long tide gauge records.
Credit: Image by Robert A. Rohde from Global Warming Art. http://en.wikipedia.org/wiki/File:Recent_Sea_Level_Rise.png
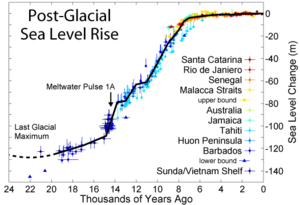
Changes in sea level since the end of the last glacial episode.
Credit: Image by Robert A. Rohde from Global Warming Art. http://en.wikipedia.org/wiki/File:Recent_Sea_Level_Rise.png
Resources
NASA: Recent Warming of Arctic May Affect Worldwide Climate
http://www.nasa.gov/centers/goddard/news/topstory/2003/1023esuice.html
News story about Arctic warming with great links to animation and additional information.
National Resources Defense Council: Global Warming Puts the Arctic on Thin Ice
http://www.nrdc.org/globalWarming/qthinice.asp
Answers to questions about the Arctic’s shrinking ice and its global significance. Also has lots of links to related data and background information.
Greenland Ice Sheet Resources
NASA: Earth Observatory
http://earthobservatory.nasa.gov/Features/Greenland/
Description of a researcher’s life and his studies as he works on the Greenland ice sheet.
“He slept on the floating tongue of Petermann Glacier (80°N) as the ice groaned and cracked with the rise and fall of the tide. He slept at high elevations of the ice sheet interior where the bitter cold made his lungs ache with each breath. He slept on the western flank of the great ice sheet near a large melting area, where a relentless, subfreezing wind rattled his tent constantly.”
Science Daily—Greenland Ice Sheet
http://www.sciencedaily.com/articles/g/greenland_ice_sheet.htm
Science reference with lots of links to related information, images, and stories.
National Geographic: Greenland Ice Sheet Is Melting Faster, Study Says
http://news.nationalgeographic.com/news/2006/08/060810-greenland.html
Article about Greenland’s disappearing ice sheet studies.
Encyclopedia.com
http://www.britannica.com/EBchecked/topic/245306/Greenland-Ice-Sheet
Encyclopedia article with links to maps, images, dictionary, thesaurus, and related articles.
The Antarctic Ice Sheet
Science News: All southern Antarctic ice shelves melting
http://www.upi.com/Science_News/2010/02/24/All-southern-Antarctic-ice-shelves-melting/UPI-56431267038057/
Short report on U.S. Geological Survey information about Antarctic ice shelves.
NASA: Impact of Climate Warming on Polar Ice Sheets Confirmed
http://www.nasa.gov/vision/earth/environment/ice_sheets.html
NASA article about results (published in the Journal of Glaciology) of a study that combined new satellite mapping of the height of ice sheets and NASA airborne mapping of the edges of ice sheets to determine how fast ice thickness is changing.
NASA: Retreat of the West Antarctic Ice Sheet
http://science.nasa.gov/science-news/science-at-nasa/2000/ast27dec_1/
Article with images, data, and related links.
NASA: Geology.com: Antarctic Sheet Melting Speeds Up
http://geology.com/nasa/antarctic-ice-sheet-melting.shtml
Article on the melting of the Antarctic ice sheet with lots of great links to related stories, images, and data.
NASA: Jet Propulsion Laboratory: NASA Mission Detects Significant Ice Mass Loss
http://www.jpl.nasa.gov/news/news.cfm?release=2006-028
Information about NASA study of ice mass loss with links to data and audio clips for media.
NASA: Antarctic Warming Claims Another Ice Shelf
http://earthobservatory.nasa.gov/Features/WilkinsIceSheet/
Stunning images of the disintegration of the Wilkins Ice Shelf on the Antarctic Peninsula.
Larsen Ice Shelf, Antarctica
Breakup of the Larsen Ice Shelf
http://earthobservatory.nasa.gov/IOTD/view.php?id=2288
Information and lots of links to images of the Larsen ice shelf.
Science Daily: The Larsen Ice Shelf
http://www.sciencedaily.com/articles/l/larsen_ice_shelf.htm
Science reference with lots of links to related information, images, and stories.
Jet Propulsion Laboratory: Glaciers Surge When Ice Shelf Breaks Up
http://www.jpl.nasa.gov/news/news.cfm?release=2004-233
Article about how scientists studied the breakup of the Larsen B ice shelf from the coast of the Antarctic Peninsula.
