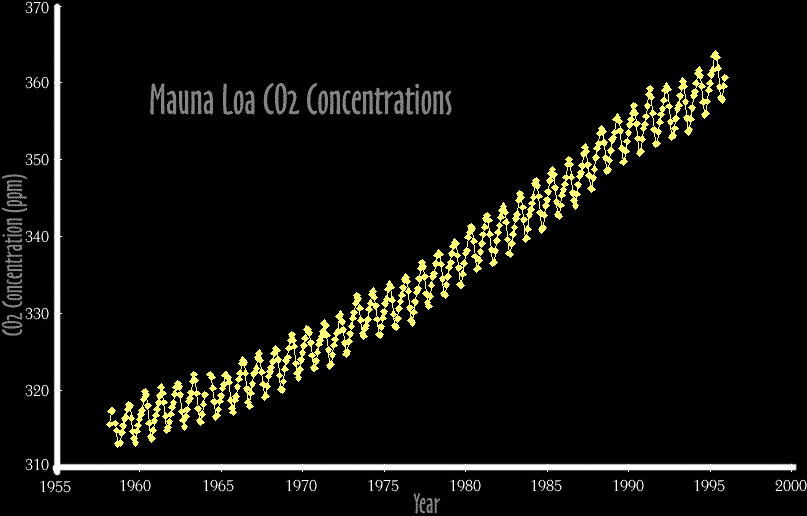
This graph of the CO2 data from Mauna Loa has two notable features; a general rise in CO2 concentration of about 14% from 1958 to 1995 and an annual cyclical variation superposed on the rising curve. Many sources have been proposed to account for the features of the CO2 data, including industrial pollution, volcanic eruptions, seasonal changes in vegetation, and biomass burning (natural and human-caused). This set of activities provides the information you need to evaluate the importance of some of these sources of CO2 in accounting for the observed CO2.
![]()
HTML code by Chris Kreger
Maintained by ETE Team
Last updated November 10, 2004
Some images © 2004 www.clipart.com
Privacy Statement and Copyright © 1997-2004 by Wheeling Jesuit University/NASA-supported Classroom of the Future. All rights reserved.
Center for Educational Technologies, Circuit Board/Apple graphic logo, and COTF Classroom of the Future logo are registered trademarks of Wheeling Jesuit University.