

FEATURED DATA
Drought
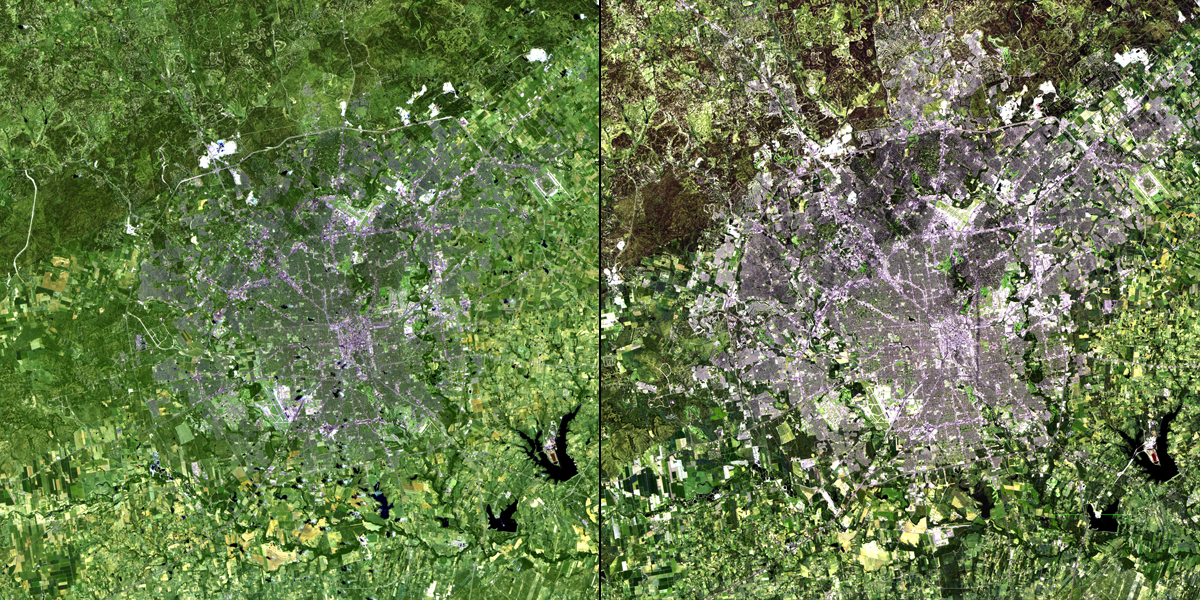
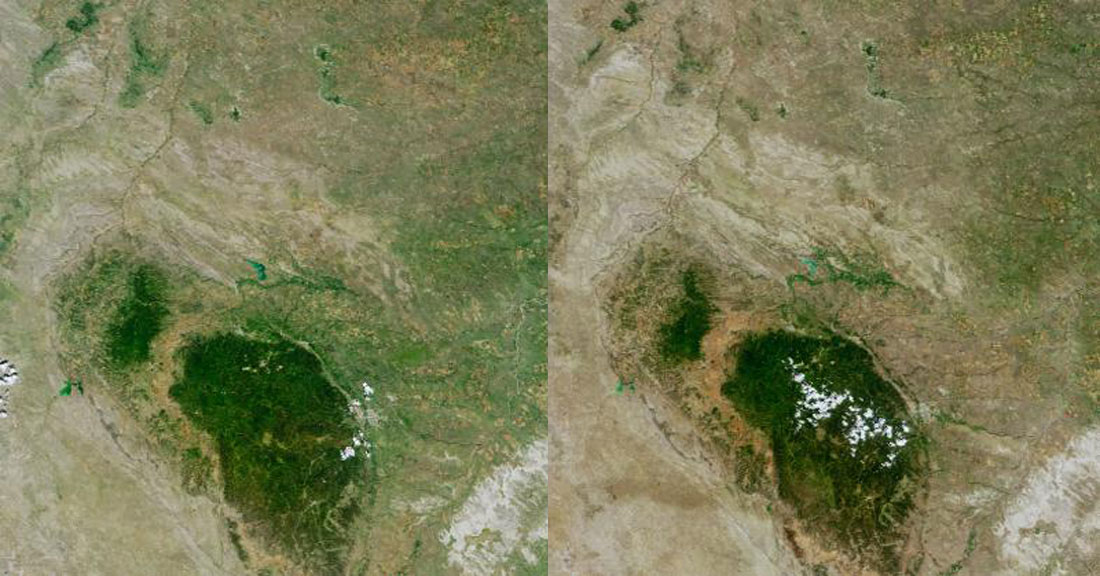
Growth of San Antonio
San Antonio, TX. Left: June 16, 1991. Right: June 4, 2010. San Antonio has grown faster during the last two decades than all but three other cities in the United States, nearly doubling from 790,000 people in 1991 to 1.4 million in 2010. Under state law, which allows the city to direct growth and zoning in much of the surrounding unincorporated land, San Antonio has opposed the creation of other nearby municipalities and has preserved agricultural production areas. A series of military bases and airfields, which ring the larger community, have also contributed to the city’s growth. Do you recognize areas that likely involve agriculture?
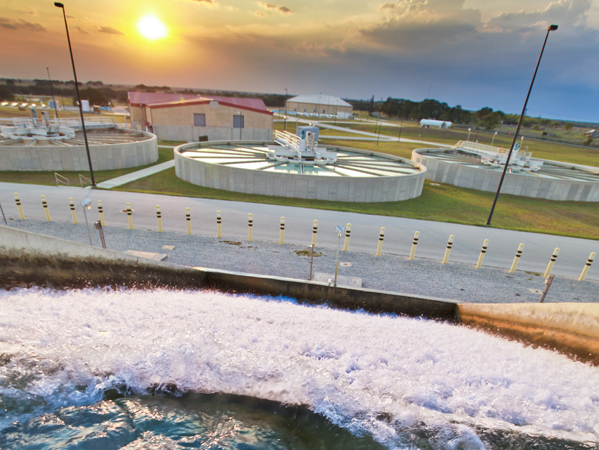
Twin Oaks Aquifer Storage and Recovery Facility
During droughts the Twin Oaks Aquifer Storage and Recovery Facility pumps water up from underground and sends it back to San Antonio for use. The facility uses water from the Edwards Aquifer and the Carrizo Aquifer.
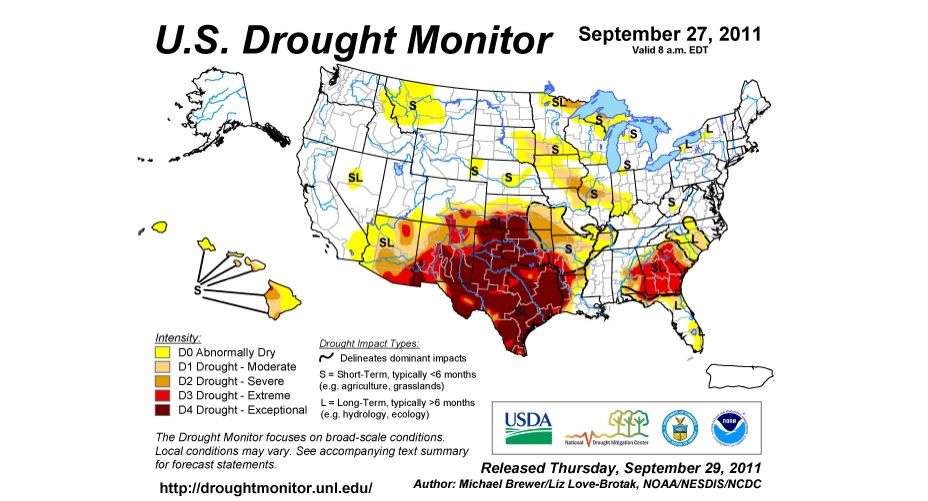
U.S. Drought Monitor
The U.S. Drought Monitor shows that conditions in the summer of 2011 were among the worst on record. Where is San Antonio located in regards to the drought-stricken areas in the Southwest?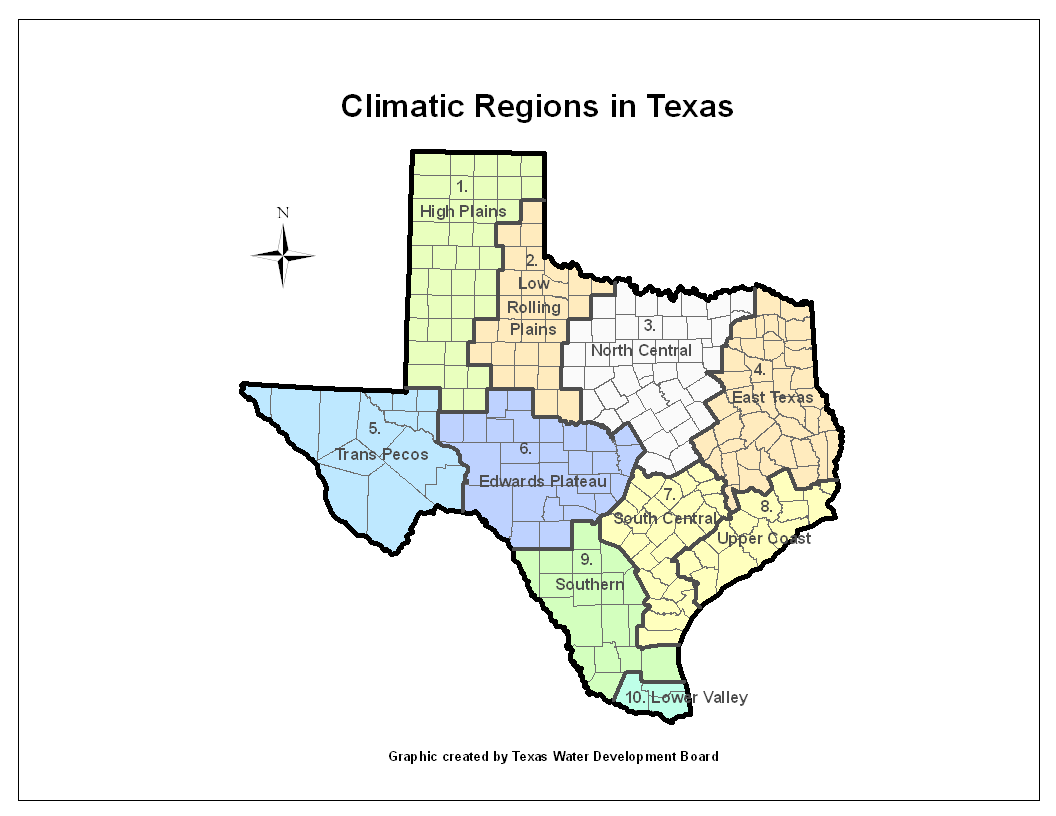
Climate Regions in Texas
This graph displays the climate regions of Texas. With a total area of 268,580 square miles, Texas trails only Alaska among the 50 states in land area. Not surprisingly because of it's massive size, the state features a variety of distinct climate regions. It's fair to say winter in a High Plains city such as Amarillo in the Texas Panhandle is a lot more harsh from winter in Corpus Christi south along the warm Gulf Coast. Why might drought conditions be more likely to strike certain areas of the state?
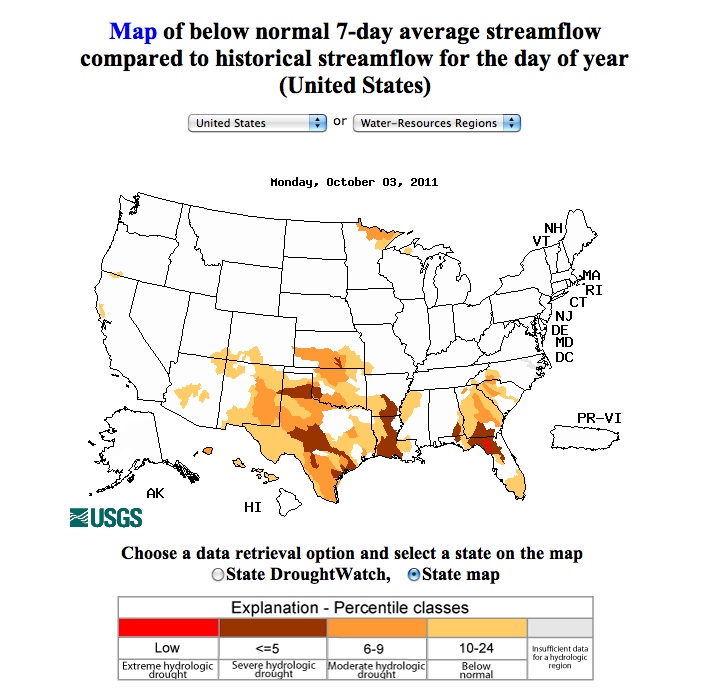
Water Watch
Map of below normal 7-day average streamflow compared to historical streamflow for the day of year (United States). This map illustrates the severe drought conditions striking a significant portion of Texas in October 2011.
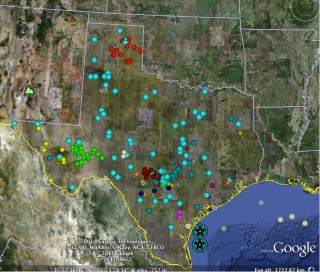
San Antonio River Valley
This image of a customized Google Earth map provides an example of how you can use Google Earth to investigate how different areas of Texas and bordering states that have been most affected by the drought. Some of the data resources accessible via this Google Earth customized map include: (1) Aquifer well depth data tables and graphs; (2) photos of wildlife with the latitude and longitude locations of sitings and comments by naturalists (see sample photo below); and (3) embedded links to featured locations such as national parks.
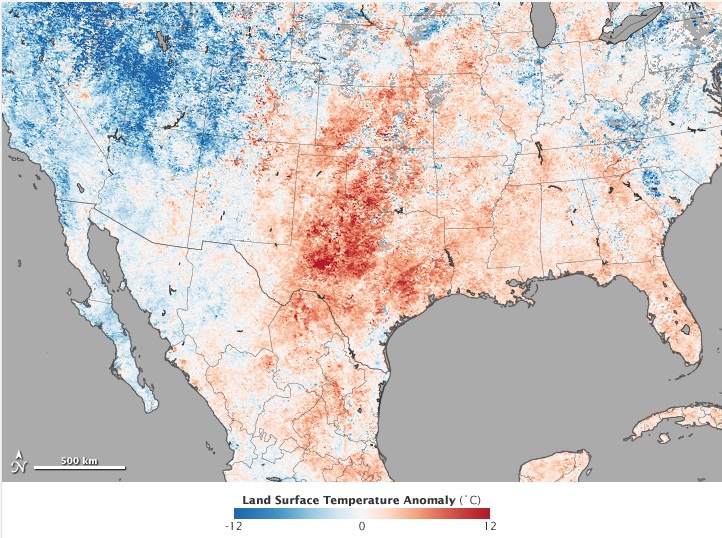
Drought and Heat Create Hazardous Fire Conditions in Texas
In 2011 more than 4 million acres were burned by wildfire in Texas. According to the Texas A&M Forest Service, there were 31,453 fires, which destroyed 2,947 homes and 2,804 other structures. Two firefighters lost their lives battling blazes. Why was fire activity so extreme in Texas in 2011? This image, made with data collected by the Moderate Resolution Imaging Spectroradiometer (MODIS) on NASA’s Terra satellite, reveals high temperatures that contributed to hazardous fire conditions.
Fire needs dry fuel to burn, and weather conditions in March and April turned Texas into a tinderbox. The state began the winter dry season with abundant vegetation, following a moist spring in 2010. But then drought settled over the state in late 2010 and early 2011, culminating in the driest March on record. Many areas received less than 5 percent of their normal rainfall, according to the state climatologist.
In addition to being dry, March and April were warmer than normal. The top image shows ground temperatures for April 7 to April 14 compared to long-term average for the week. The red tones indicate that most of Texas was much warmer than average, further drying out the abundant grasses, shrubs, and trees already suffering from a lack of rain.
The warm temperatures and dry vegetation combined with high winds and low humidity to create extremely dangerous fire conditions in Texas. Indeed, the MODIS true color image on April 15 showed strong winds blowing long plumes of smoke from multiple fires across the state.
Drought in the Black Hills
The Black HIlls that range from South Dakota to Wyoming in the United States. Left: July 12, 2000. Right: July 24, 2004. These natural-color images were taken by NASA's Multi-angle Imaging SpectroRadiometer (MISR) from its nadir (downward-looking) camera. The browning that appears in 2004 compared with 2000 indicates that the vigor of green vegetation was significantly diminished in 2004.
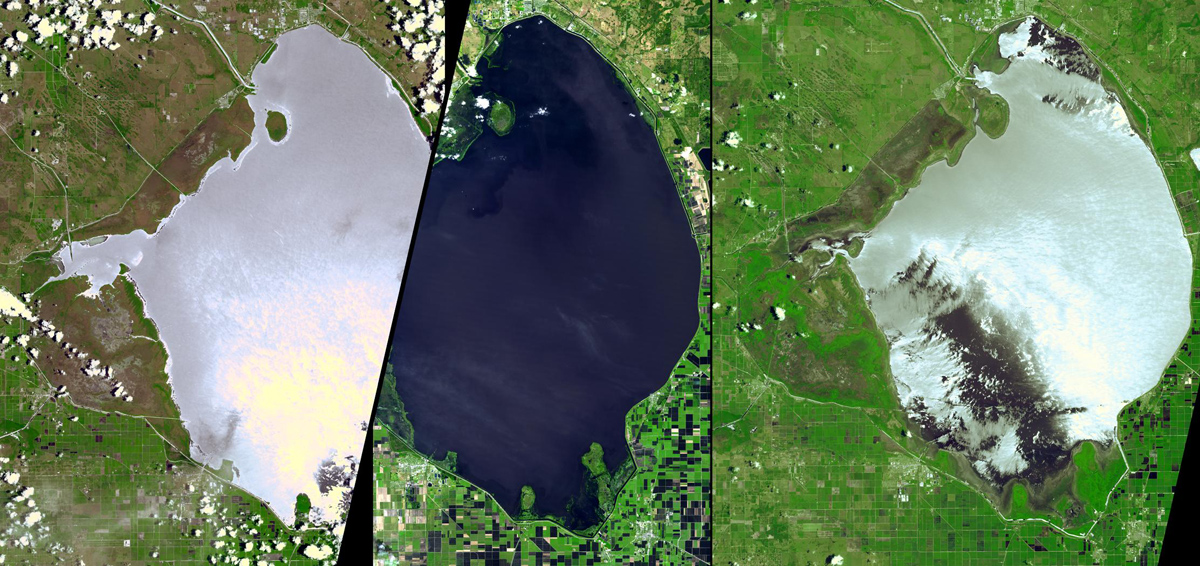
Okey Dokey Okeechobee?
Lake Okeechobee, FL. Left: June 19, 2000. Middle: January 19, 2003. Right: June 23, 2007. The second-largest freshwater lake wholly within the continental United States has been shrinking because of drought, agriculture, and residential use. The water level in the 2007 image is about 2.7 meters (8.9 feet) high, which is about 1 meter (3 feet) below its historical average for that time of year. Reduction of the lake’s area is particularly evident in the west and southeast of the image.
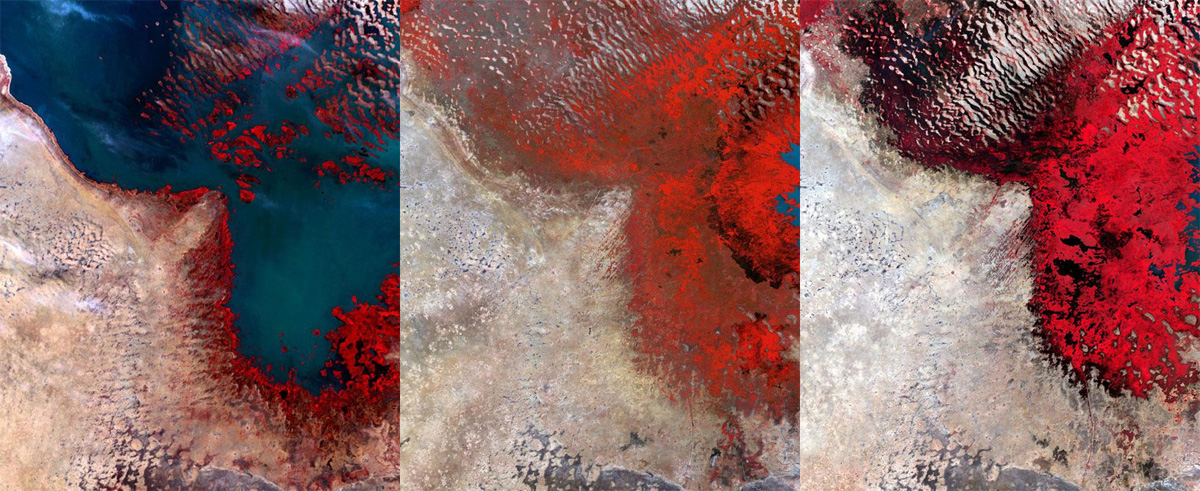
Shrinking Lake Chad
Lake Chad, Africa. Left: Dec. 8, 1972. Middle: Dec. 14, 1987. Right: Dec. 18, 2002. Persistent drought has shrunk Lake Chad, once the world’s sixth largest lake, to about one-twentieth of the size it was in the 1960s. Only 16 to 26 feet (5 to 8 meters) deep in “normal” times, small changes in depth have resulted in large changes in area. As the lake has receded, large wetland areas (shown in red) have replaced open water.
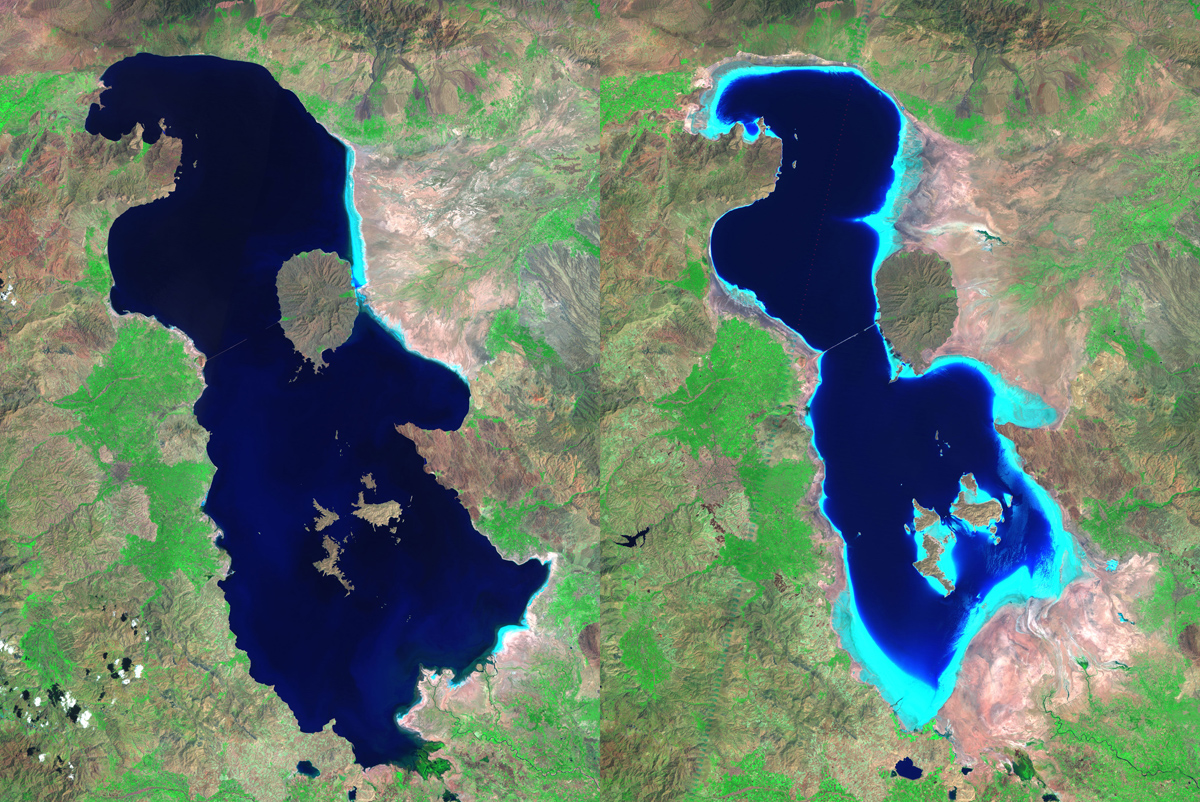
Drying Out
Left: August 1985. Right: August 2010. Iran’s Lake Oroumeih (also spelled Urmia) is the largest lake in the Middle East and the third largest saltwater lake on Earth. But dams on feeder streams, expanded use of groundwater, and a decades-long drought have reduced it to 60 percent of the size it was in the 1980s. Light blue tones in the 2010 image represent shallow water and salt deposits. Increased salinity has led to an absence of fish and habitat for migratory waterfowl. At the current rate, the lake will be completely dry by the end of 2013.
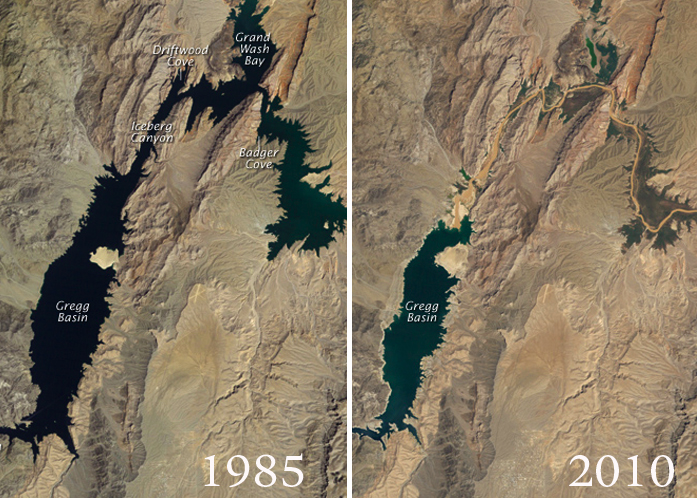
Lake Mead
These two NASA satellite images show the decreased water levels in Lake Mead between 1985 and 2010. Lake levels increased steadily through the 1980s, reaching 24.8 million acre-feet in August, 1985 (left image). As of August, 2010, however, Lake Mead held just 10.35 million acre-feet of water — about 37 percent of the lake’s capacity.
According to the National Park Service, Lake Mead stores Colorado River water for delivery to farms, homes, and businesses in Southern Nevada, Arizona, Southern California and Northern Mexico. About 96 percent of the water in Lake Mead is from melted snow that fell in Colorado, Utah, New Mexico, and Wyoming. Each year, Lake Mead receives a minimum amount of Colorado River water from these states, known as the "Upper Basin" states. And each year, a specific amount of water is released from Lake Mead to users in Nevada, Arizona, California, and Mexico. In an "average" year the amount of water flowing out of Lake Mead exceeds the amount of water flowing into Lake Mead.
In some years, Lake Mead receives much more than the minimum amount of water from the Upper Basin, but the amount of water released from Lake Mead does not vary much from year to year. The water level in Lake Mead is lower than it has been in more than 40 years. The water is going down because the Colorado River runoff over the last decade starting in 1998 has been far below normal. But the amount of water going out from Lake Mead has remained at normal levels. So, there has been more water going out of Lake Mead over the past decade starting in 1998 than there has been coming into the lake. This causes the elevation to drop a little more each year.
The variation in water flowing into Lake Mead and the water flowing out of Lake Mead causes the lake's water level, or "elevation," to fluctuate yearly and over multiyear periods, and it has done so throughout the reservoir's 70-plus year history. This is normal, and it is how Lake Mead was designed to work.
If there are several consecutive years where outflow exceeds inflow, Lake Mead begins each year with lower water levels, and the elevation continues to drop until a "wet year" occurs in the Colorado River. Then, Lake Mead typically receives more water than it releases, and the lake again returns to higher elevations.
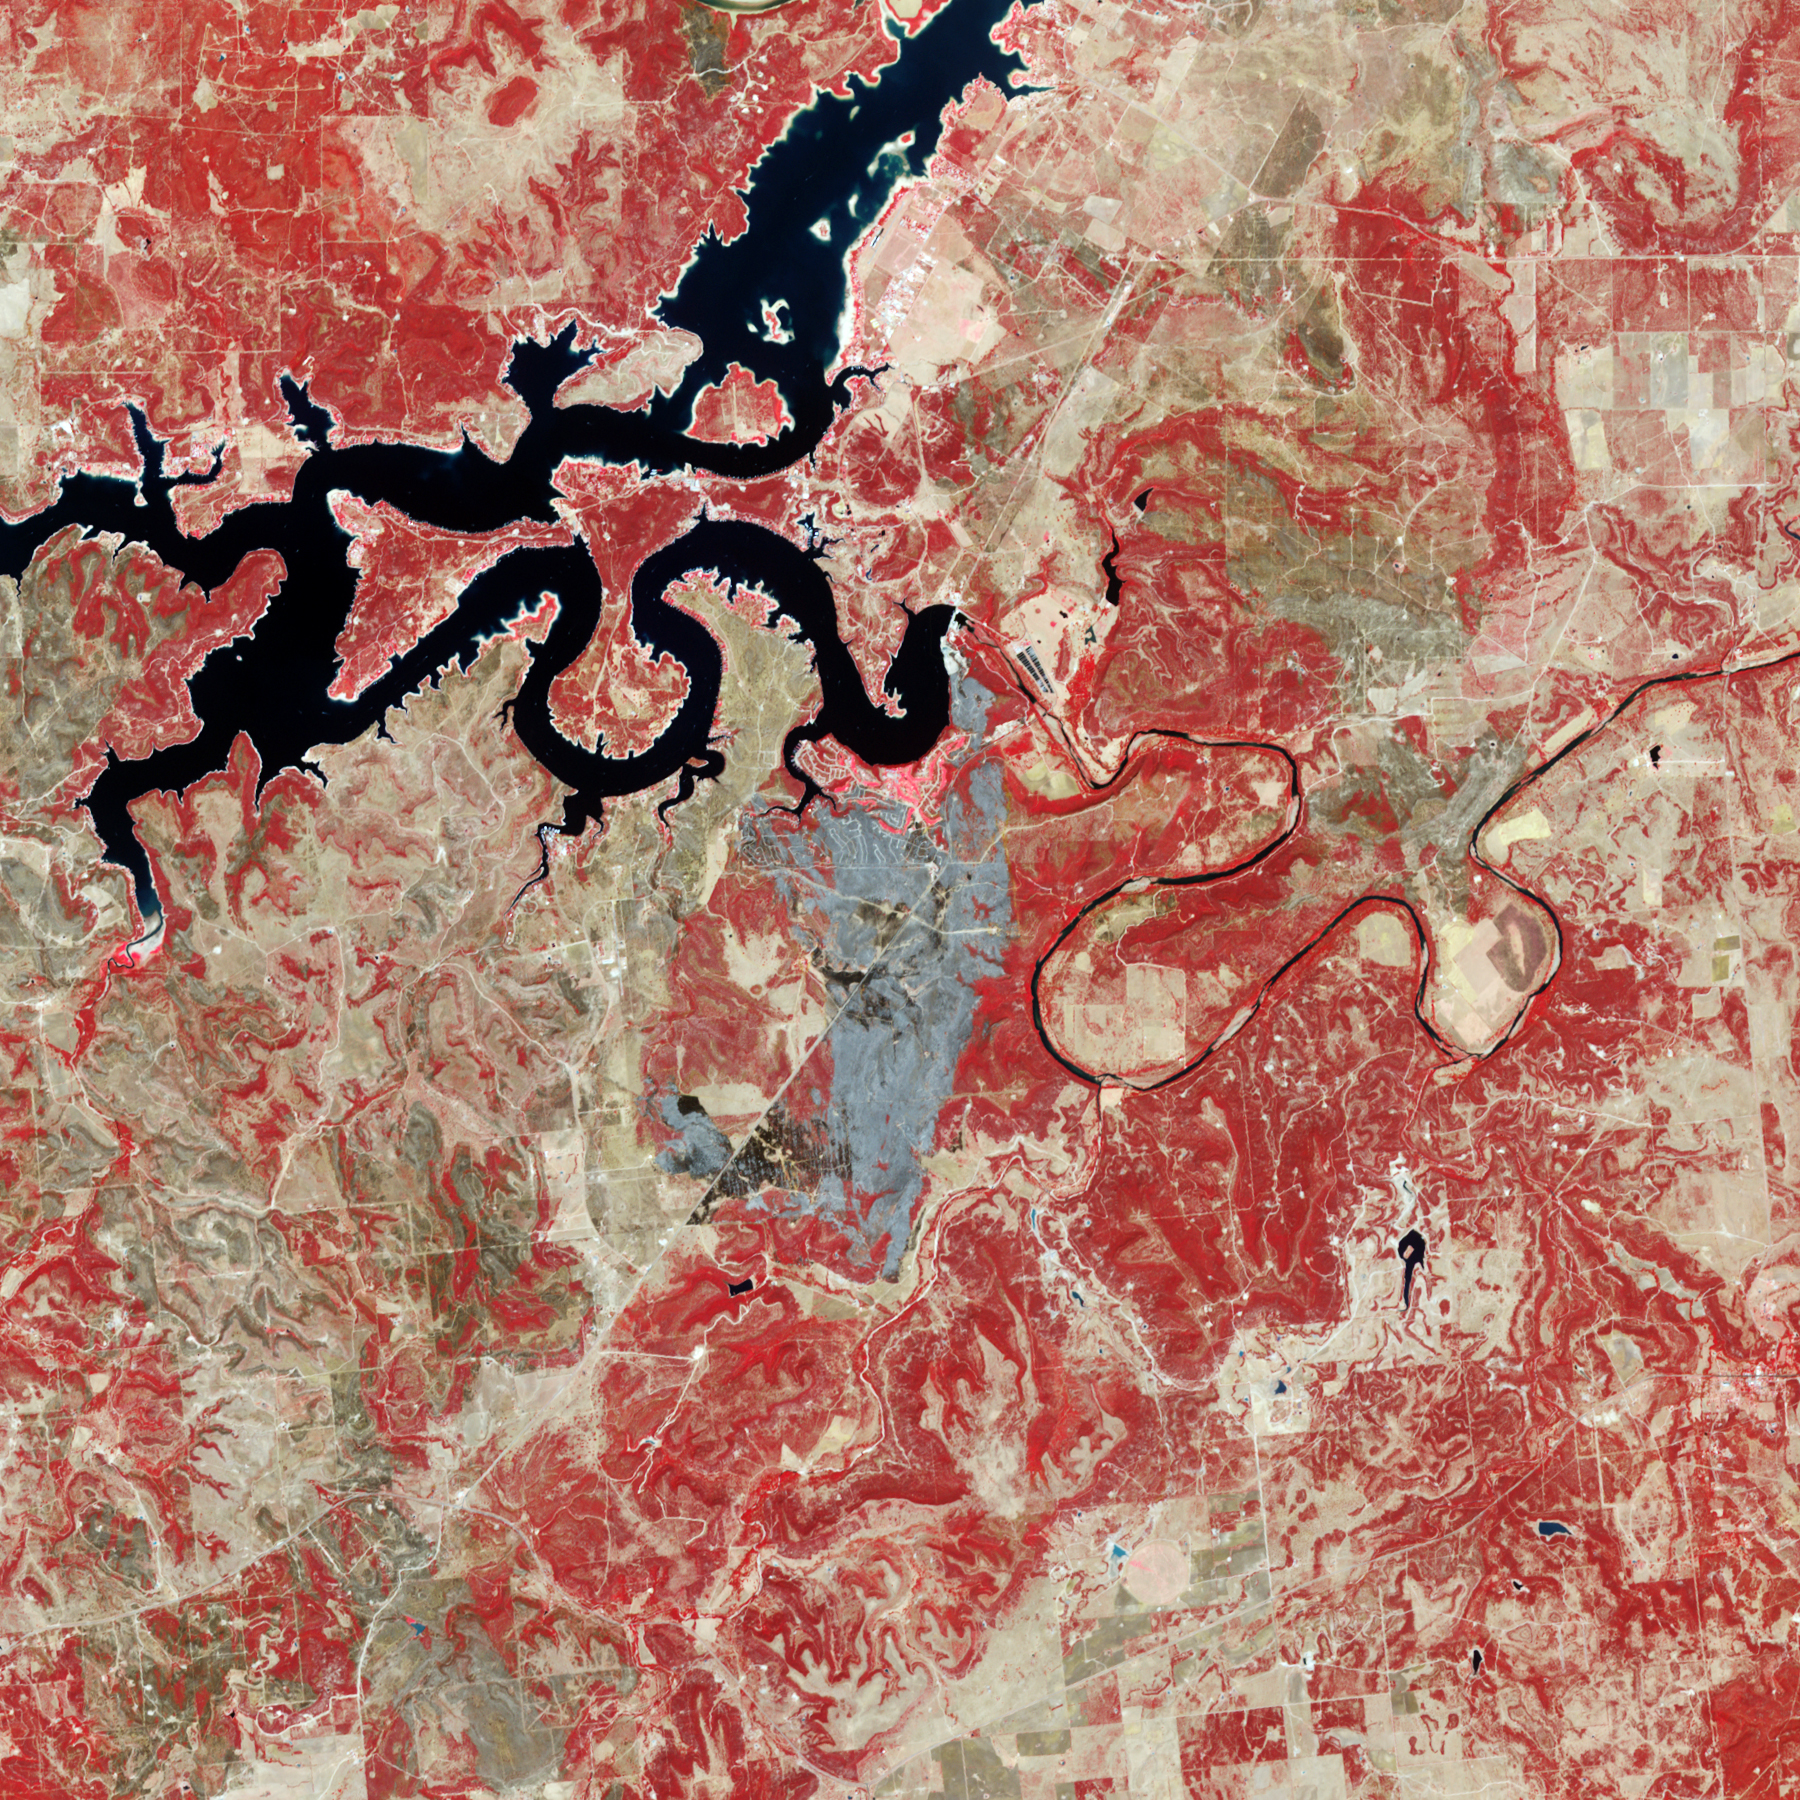
101 Ranch Fire Scar Burn
Large parts of Texas suffered from severe drought in the summer of 2011. The burn scar is gray, vegetation is red, and bare or sparsely vegetated ground is tan. Water is navy blue.
The 101 Ranch Fire began on August 30, 2011, south of Possum Kingdom Lake in Palo Pinto County, TX. By Sept. 6, the fire had scorched 6,555 acres (2,653 hectares), according to the Incident Information System.
The Advanced Spaceborne Thermal Emission and Reflection Radiometer (ASTER) on NASA’s Terra satellite captured this false-color image of the Ranch 101 burn scar on Sept. 3, 2011.
Just south of the easternmost curve of Possum Kingdom Lake is a network of residential streets, some of which lie within the burn scar. The Texas Forest Service reported that 39 homes and nine RVs had been destroyed. Although dozens of homes had been lost, firefighters saved nearly 200 others.
The fires came in the midst of high temperatures and low humidity. Large parts of Texas suffered from severe drought in the summer of 2011.
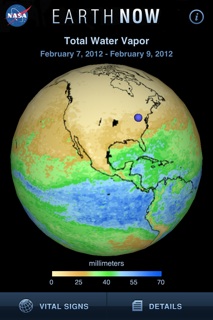
Earth Now: Water Vapor
NASA's Earth Now is an application that visualizes recent global climate data from Earth science satellites, including surface air temperature, carbon dioxide, carbon monoxide, ozone, and water vapor as well as gravity and sea level variations. Data sets are visually described using "false color" maps. Color-coded legends are provided to indicate relative strength or weakness of an environmental condition. The resulting 3-D model of the Earth may be rotated by a single finger stroke and may also be zoomed in or out by pinching two fingers. It was developed by the Earth Science Communications and Visualization Technology Applications and Development teams at NASA's Jet Propulsion Laboratory with support from NASA headquarters.
Link to app: http://itunes.apple.com/us/app/earth-now/id494633346?mt=8
