Volcanoes
Volcanoes, Greenhouse Gases, and Temperature Change
You have probably already heard the term “greenhouse gas” in science class or on the news, and you may have wondered what is so special about these gases. You learned the atmosphere is the layer of gases surrounding Earth, and quite a few of the greenhouse gases occur naturally. So, what’s the problem?
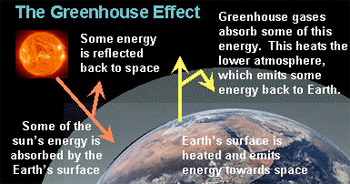
A greenhouse gas (GHG) is any gas in the atmosphere that takes in (absorbs) and gives off (emits) radiation in the heat (infrared) wavelength range. Greenhouse gases cause the greenhouse effect, which results in increased temperatures on Earth.
The greenhouse effect occurs as solar radiation reaches the Earth’s surface. As the sun’s energy heats the surface, some of the heat energy radiates back into the atmosphere as infrared radiation and back toward space. But greenhouse gases in the atmosphere absorb some of the infrared radiation energy and “trap” it in the lower atmosphere. Less heat radiates into space, and the Earth is warmer.
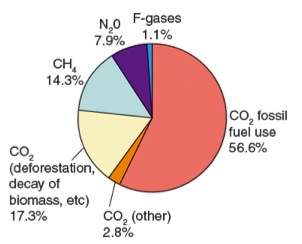
Many greenhouse gases occur naturally. Carbon dioxide, methane, water vapor, and nitrous oxide are naturally present in Earth’s atmosphere. Others, such as chorofluorocarbons (CFCs), hydrofluorocarbons (HFCs), perfluorocarbons (PFCs), and sulfur hexafluoride (SF6), are human made.
Since the Industrial Revolution atmospheric greenhouse gas concentrations have been rising. Increasing population and increased use of fossil fuels for energy result in a sharp rise in greenhouse gases, especially CO2, and increased temperatures.
Volcanoes also give off greenhouse gases. The most abundant gas released from volcanic eruptions is water vapor. Other emitted gases include carbon dioxide (CO2), sulfur dioxide (SO2), hydrogen sulfide (H2S), carbon monoxide (CO), hydrogen chloride (HCl), and hydrogen fluoride (HF).
Read about the characteristics and implications of some of the major greenhouse gases below. Use the Related Links and other resources in this module to investigate other volcanic greenhouse gases and their effects on global climate.
Water Vapor
Water vapor is the most abundant greenhouse gas in Earth’s atmosphere. Changes in the concentration of water vapor in our atmosphere are not attributed directly to industrialization, but to feedbacks related to climate warming. Although the water cycle is well understood, feedback loops connecting the water cycle and climate changes are still poorly understood for the most part.
Of course, some feedback mechanisms are accepted. As temperatures in the atmosphere increase, evaporation of water increases. Evaporation increases at all water reservoir sites—groundwater, rivers, streams, oceans, soils. Because the air is warm, the water can “hold” more moisture. The increased amounts of water vapor in the atmosphere can then absorb more thermal energy radiated from the Earth, and this further warms the atmosphere. (This is called a positive feedback loop because the effect increases with each part of the cycle.)
The water vapor eventually condenses and forms clouds. Clouds can reflect some solar radiation and result in a cooling effect. How much of a cooling effect this can have is variable and difficult to measure accurately.
Carbon Dioxide
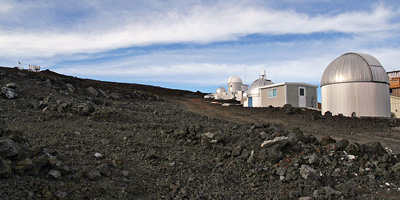
Two observatories at the Mauna Loa Observatory complex in Hawaii. Image courtesy: NASA Earth Observatory.
Carbon dioxide is perhaps the most widely studied greenhouse gas. Dr. Charles Keeling, an American scientist, began recording atmospheric carbon dioxide measurements at the summit of the Mauna Loa Observatory in 1958. His studies were the first to warn the world of the anthropogenic (human caused) contributions to global warming. A result of his extended studies, the famous “Keeling Curve,” documented the ongoing buildup of carbon dioxide in Earth’s atmosphere.
Dr. Keeling and his team’s data also showed a strong seasonal variation in carbon dioxide levels. Peak levels occur in late winter in the Northern Hemisphere. Lowest levels occur in spring and early summer. Notice that the variations can be explained by considering what is happening to plant growth during those times. Plant growth in spring and early summer reduces atmospheric CO2 through the process of photosynthesis; during winter, plants cannot have the same mediating effects, and atmospheric CO2 rises.
Other processes affect CO2 concentrations. Geologic (rocks, soil) and hydrologic (water) processes and cycles also affect both the emission and uptake of carbon dioxide from Earth’s environments. Anthropogenic processes have altered the natural balance mechanisms. Concentrations were fairly stable at 280 ppm (parts per million) before the Industrial Revolution. Now, they hover around 370 ppm and are still increasing.
Atmospheric Carbon Dioxide Concentrations (ppm)
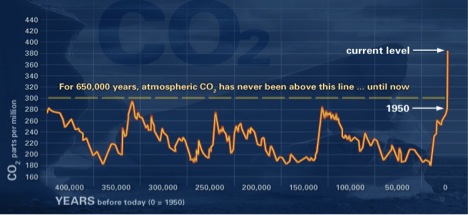
The data presented in the graph above was obtained from atmospheric samples contained in ice cores and for recent times from direct atmospheric measurements. This graph illustrates long-term CO2 cyclic variations and highlights the reason for concern about the most recent CO2 levels in the atmosphere.
Source: NOAA graph at http://climate.nasa.gov/evidence/.
Methane
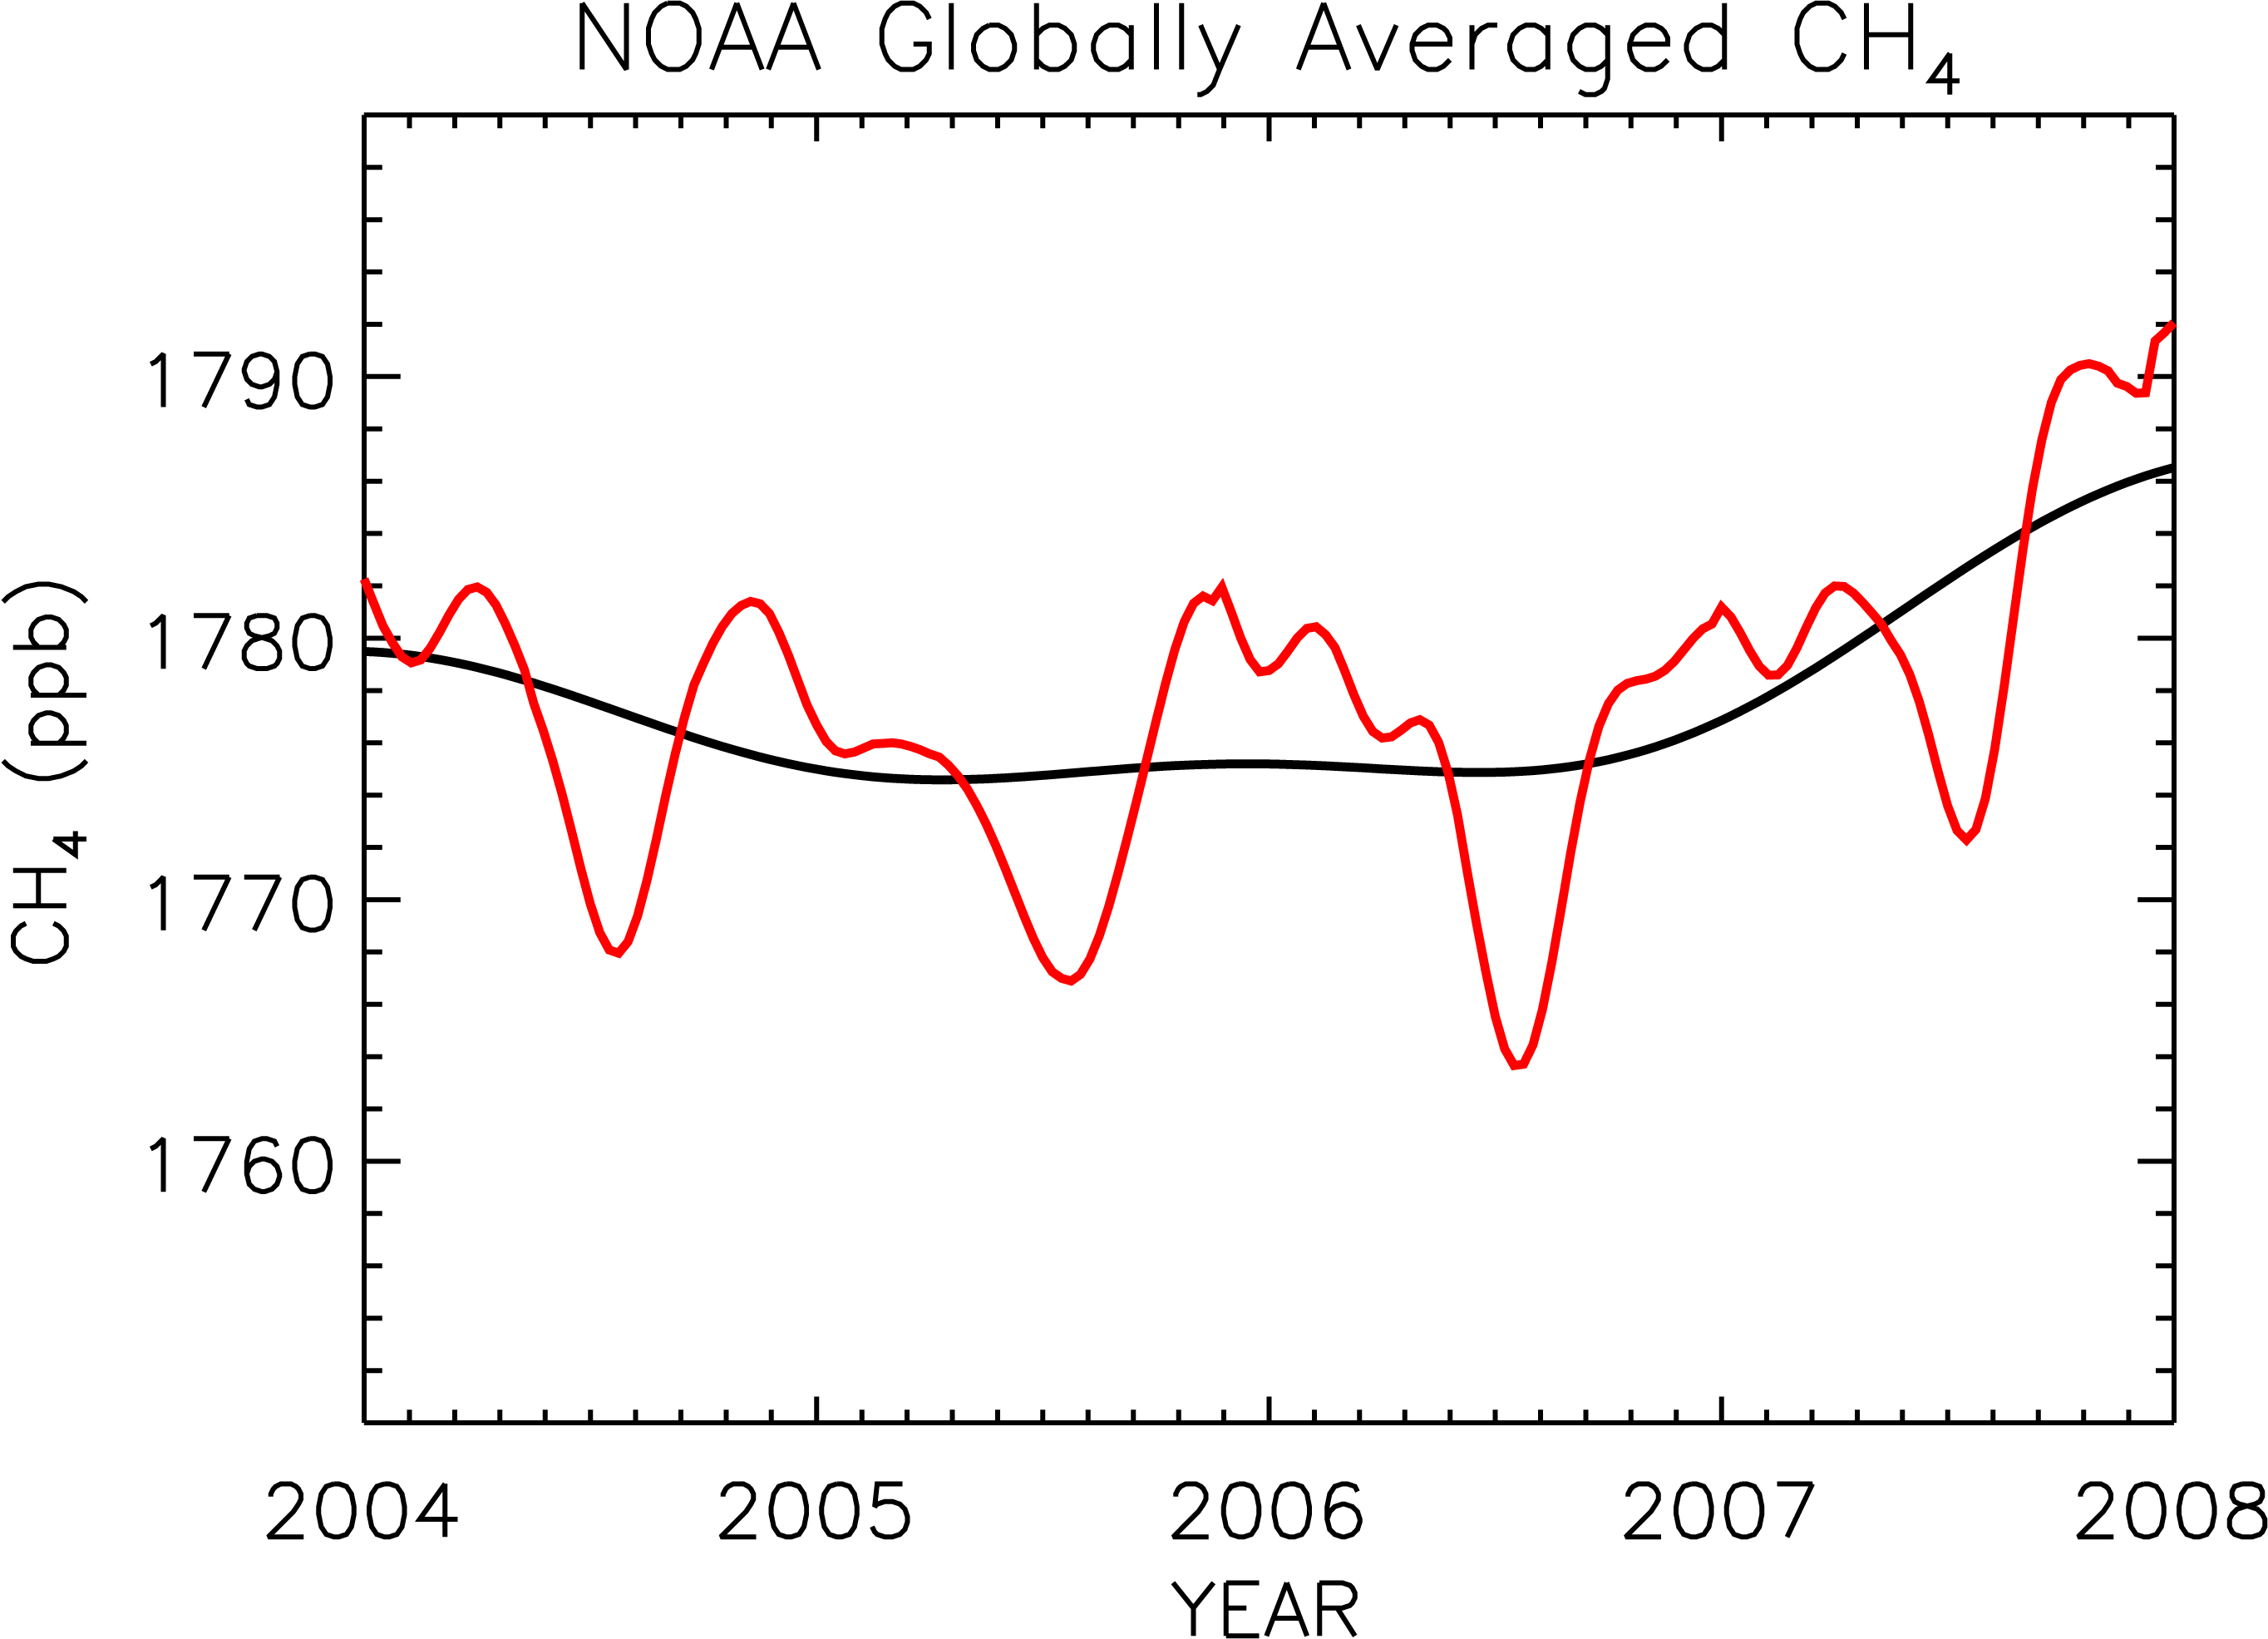 Methane is released into the atmosphere by both natural and anthropogenic sources. It is released in low oxygen environments such as swamps and bogs and through the roots of some plants. Anthropogenic sources have increased methane emissions through increased use of natural gas and through mining.
Direct measurement of methane in the atmosphere began in the late 1970s. Concentrations have increased slowly with fluctuations since then. Image: (Right) Global methane (CH4) concentrations rose in 2007. The red line shows the trend together with seasonal variations. The black line indicates the trend that emerges when the seasonal cycle has been removed. Image credit: NOAA.
Tropospheric Ozone
Ozone is formed through reaction of ultraviolet radiation and oxygen in the stratosphere. A small portion of this ozone falls through the atmosphere to the surface of Earth. The layer of air next to the surface of Earth is the troposphere. In recent years the ozone in the troposphere has been increased through irradiation of emission particles from cars and pollution from factories. Ozone contributes greatly to photochemical smog concentrations in many urban areas.
According to some research, concentrations of trophospheric ozone have risen by 30 percent since the Industrial Revolution. The Intergovernmental Panel on Climate Change regards it as the third most important greenhouse gas (after carbon dioxide and methane).
Nitrous Oxide
Nitrous oxide is produced by microbial (bacterial) processes in soil and water. The use of fertilizers with nitrogen and some industrial processes also contribute to atmospheric N2O.
Chlorofluorcarbons
Chlorofluorocarbons (CFCs) are manmade gases used as refrigerants, aerosol propellants, and cleaning solutions. They can destroy stratospheric ozone, and a global effort to stop their production has been very successful. Levels of some of the major CFCs are now declining.
Because of their long atmospheric lifetimes, some concentrations will stay in the atmosphere for more than 100 years. They comprise quite a few of the synthetic gases known to be greenhouse gases—gases capable of increasing Earth’s temperatures. Other synthetic gases, such as CF4 (carbontetrafuoride), SF6 (sulfurhexafluoride), and the hydrofluorcarbons (HFCs), are also problematic as substances that have been used to avert the destruction of the ozone layer, but which could increasingly contribute to climate warming, according to scientists from NOAA's Earth System Research Laboratory.
Aerosols
Although not a greenhouse gas, aerosols can have an effect on climate temperatures. Aerosols are small particles in the atmosphere from volcanoes, smoke, dust, industry, and other sources. Aerosols can absorb and scatter radiation. This causes either warming OR cooling, depending on the aerosol. Aerosols are also important in the formation of clouds and can, therefore, affect the water cycle and precipitation.
