
![]()
![]()
![]()
![]()

![]()
Carbon
Dioxide: Precipitation
The effects of carbon
dioxide (CO2) on precipitation patterns are a result of the effects of
CO2 on average air temperature. Carbon dioxide
cause the earth's average air temperature to increase. Higher temperatures
cause particles in the earth's atmosphere to move faster. This creates
more energy in the earth's atmosphere. The energy causes air and water to move around the planet. The result
can be as simple as a slight breeze or as complex as the formation of
a hurricane. The greater the amount of energy in the atmosphere, the more
severe the weather. There is evidence of increased energy in the
atmosphere over the
United States, where the occurrence of severe weather has been increasing
over the past century.
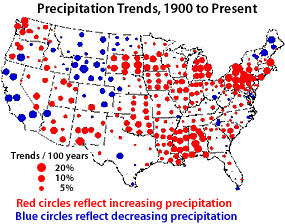 In
addition to increasing the energy in the atmosphere--and thus increasing
the intensity of weather events-- elevated temperatures can cause increased
evaporation from the earth's surface. This may lead to declines in the
amount of precipitation at lower latitudes and increases in the amount
of precipitation at higher latitudes. At lower latitudes, the
temperature would be warmest. There would be much evaporation from these
regions. The highly energized air would then carry the water vapor to
higher latitudes. The excess water would eventually fall out as increased
precipitation over these regions. Over the past century, this trend
has been observed. Although precipitation has increased
globally by about 1% in the past century,
the amount of precipitation in tropical areas has declined. At the same
time, there has been nearly a 5% net increase in precipitation across the
United States. Precipitation trends across the United States for
the past 100 years can be seen in the figure above. Image:
Precipitation trends across the United States from 1900 to the present.
Figure courtesy of the United States Environmental Protection Agency.
In
addition to increasing the energy in the atmosphere--and thus increasing
the intensity of weather events-- elevated temperatures can cause increased
evaporation from the earth's surface. This may lead to declines in the
amount of precipitation at lower latitudes and increases in the amount
of precipitation at higher latitudes. At lower latitudes, the
temperature would be warmest. There would be much evaporation from these
regions. The highly energized air would then carry the water vapor to
higher latitudes. The excess water would eventually fall out as increased
precipitation over these regions. Over the past century, this trend
has been observed. Although precipitation has increased
globally by about 1% in the past century,
the amount of precipitation in tropical areas has declined. At the same
time, there has been nearly a 5% net increase in precipitation across the
United States. Precipitation trends across the United States for
the past 100 years can be seen in the figure above. Image:
Precipitation trends across the United States from 1900 to the present.
Figure courtesy of the United States Environmental Protection Agency.
Overview
..|..
Temperature ..|..
Precipitation
..|..
Plants
Glossary ..|..
Related
Links ..|..
References
|..
PBL
Model
Home ..|.. Teacher Pages ..|.. Modules & Activities
HTML code by Chris
Kreger
Maintained by ETE
Team
Last updated November 10, 2004
Some images © 2004 www.clipart.com
Privacy Statement and Copyright © 1997-2004 by Wheeling Jesuit University/NASA-supported Classroom of the Future. All rights reserved.
Center for Educational Technologies, Circuit Board/Apple graphic logo, and COTF Classroom of the Future logo are registered trademarks of Wheeling Jesuit University.