
 |
Remote Sensing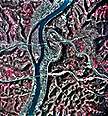 A high-level aerial photograph
can provide an overview of relatively large areas. The infrared aerial photo of downtown
Wheeling shows the Ohio River and lower Wheeling Creek as they appeared in 1991. Can you
see the coal barge moving up the river past the railroad bridge? That bridge is no longer
there. Compare a closer view of the six sites with the color photograph and topographic
map below. Left: High-level
aerial photograph over Wheeling, WV. Photo: Courtesy of Dr. Ben Stout A high-level aerial photograph
can provide an overview of relatively large areas. The infrared aerial photo of downtown
Wheeling shows the Ohio River and lower Wheeling Creek as they appeared in 1991. Can you
see the coal barge moving up the river past the railroad bridge? That bridge is no longer
there. Compare a closer view of the six sites with the color photograph and topographic
map below. Left: High-level
aerial photograph over Wheeling, WV. Photo: Courtesy of Dr. Ben Stout
Compare information provided by the three types of images. Which image is best? Do all contribute useful information? Consider these questions: What are some of the differences that occur at sites 2.6, 5.4, 6.2, 7.4, 10.6, and 12.0 km (1.6, 3.6, 3.9, 4.6, 6.6, 7.5, mi., respectively) upstream of the Ohio River. Compare the forest canopy, distance from the stream to nearby roads and buildings, and amount of "green space" around the streams in each photograph. How do these visual attributes compare with the biological community data presented in Scenario #1? [ Background Information ]
[ Site Description & Photos ] [ Home ] [ Teacher Pages ] [ Modules & Activities ] |
![]()
HTML code by Chris Kreger
Maintained by ETE Team
Last updated November 10, 2004
Some images © 2004 www.clipart.com
Privacy Statement and Copyright © 1997-2004 by Wheeling Jesuit University/NASA-supported Classroom of the Future. All rights reserved.
Center for Educational Technologies, Circuit Board/Apple graphic logo, and COTF Classroom of the Future logo are registered trademarks of Wheeling Jesuit University.
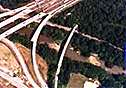 Low-level aerial photographs are
particularly useful for identifying features near sampling sites. Local features, as well
as the distance from the Ohio River, may have an impact on the site's water quality.
Photo: Courtesy of Dr. Ben Stout
Low-level aerial photographs are
particularly useful for identifying features near sampling sites. Local features, as well
as the distance from the Ohio River, may have an impact on the site's water quality.
Photo: Courtesy of Dr. Ben Stout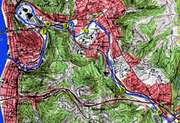 A topographic map can help to
locate features near stream sites and to document the location of stream sites for future
reference. In addition, it can provide measures for identifying stream gradient, stream
order, distance from the mouth, distance to the headwaters, watershed area, and amount of
forested land. Topographic maps are available from the U.S. Geological Survey. Photo: Courtesy of Dr. Ben Stout
A topographic map can help to
locate features near stream sites and to document the location of stream sites for future
reference. In addition, it can provide measures for identifying stream gradient, stream
order, distance from the mouth, distance to the headwaters, watershed area, and amount of
forested land. Topographic maps are available from the U.S. Geological Survey. Photo: Courtesy of Dr. Ben Stout