- Import MISS4 (512 x 512)
- invert
- enhance
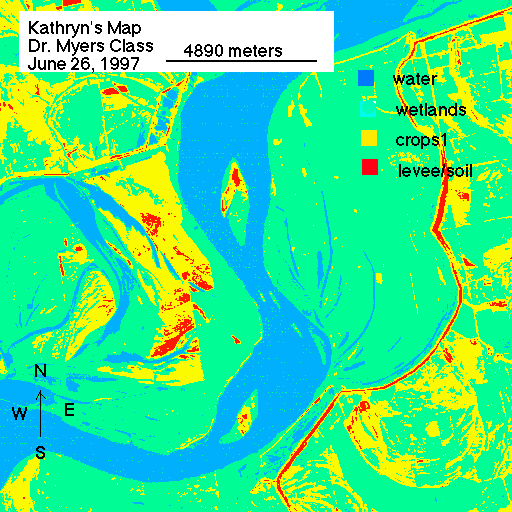
- River
- levees
- meander
- wetlands
- crops
- island
LOOK AT THE NUMBERS
The task at hand now is to group data number values (reflected light) that are similar together. For example, water has low data number values because it absorbs lights. Using the density slice tool provided in NIH Image pixels with similar values can be grouped together.
- Options
- Density Slice
When this command is activated the group of pixels represented by the red bar, the pixels on the image, and the values on the histogram are all the same. The red band in the slicing bar is tricky to use. Using the LUT tool the band can be moved up and down and also increased or decreased. Move the bar around to get the feel of the tool. After the use of the tool becomes natural, adjust the bar and record the DN values for the following features. Identify the lower and the upper DN value.
- Water__________lower value__________upper value__________
- wetlands________lower value__________upper value__________
- crops__________lower value__________upper value__________
- leevees/bare soil__lower value__________upper value_________
It is annoying, but the histogram has to be displayed each time the DN bar is moved. Compare the results with the ones listed below,
- water__________lower value__ 4 __upper value___ 15 ___
- wetlands________lower value __ 16 __ upper value__ 30 ___
- crops__________lower value __ 31 ___ upper value___ 47 ___
- leevees/ bare soil___lower value __ 48 ___ upper value ___ 79 ___
In order to make a land cover map, the range of values selected above now have to be given one value per land type. For example, all values from 4-15 could be assigned a value of 20, all values of 16-30 could be assigned a value of 60, 31-47 would become 150, and 48-79 would be 200. This groups spectral values together and makes a land cover map that can be used to calculate areas from the imagery. This is an advantage not only of satellite imagery but of digital data.
For centuries maps have been used to convey information. Not only should maps be as accurate as possible, they can be considered works of art. The colors, fonts, legends, and scale bars should not only be correct they should be as attractive as possible.
The steps to make the land cover map are tedious and should be followed carefully.
- File
- New
- width 512
- height 512
- map
- save as
- map
- Process
- Apply Lut
- OK
The image now has the spectral values of 4-15 replaced with 20 and everything else is white.
How could you determine the area of how much land is water?
- Double click on the dancing ants. This copies the entire image. Notice the ants dancing all around the image.
- Edit
- Copy Selection
- File
- Open "map"
- Edit
- Paste
- Click on anything else to get rid of the dancing ants.
- Save
- Go back to miss4.
- File
- Revert to saved.
- Options
- Invert
- OK
- Repeat the steps between the lines
for wetlands. Assign wetlands a value of
60. When pasting the second image
(wetlands)
- Edit
- Paste
- Windows
- Show Paste Control
- Transfer Mode
- OR
- Click anywhere else to get ride of the dancing ants.
- File
- Save
- File
- Revert to saved.
- Options
- Invert
- OK
- Repeat the steps between the lines
for urban. Assign cropss a value of 150.
When pasting the third image (crops)
- Edit
- Paste
- Windows
- Show Paste Control
- Transfer Mode
- OR
- Click anywhere else to get ride of the dancing ants.
- File
- Save
- File
- Revert to saved.
- Options
- Invert
- OK
- Repeat the steps between the lines
for levees/bare soil. Assign vegetation a
value of 200. When pasting the fourth
image (levees and bare soil)
- Edit
- Paste
- Windows
- Show Paste Control
- Transfer Mode
- OR
- Click anywhere else to get ride of the dancing ants.
- File
- Save
- CREATING A LEGEND, SCALE, and COMPASS BAR
A map must have a legend, a scale bar, and a compass before it is complete. These map be drawn on the image directly or they can be made as new images and pasted on the finished map.
- MEASURING LAND TYPES
In order to measure the area of different types of land cover area the scale of the image must be set.
- Using the measuring tool measure 1 pixel.
- Analyze
- Set Scale
- pixel
- known distance is 30
- unit is meters
- OK
Calculate the area of the entire image. If this image is 512 width and 512 height and 30 meter resolution, the are in square meters would be 512 x 512 x 30 x 30 sq meters.) The next step is to calculate each type of land (water, wetlands, crop1, and levees/bare soil)
- Options
- Density slice
- Highlight Water
- Analyze
- Measure
- Show results.
- Repeat the above steps for wetlands, crops, and levees/bare soil.
- Record your answers.