
|
Regional
Scale: Rwanda and Neighbors
This GIS set gives
information about various aspects of the region around
the nation of Rwanda. As with the previous stack, all of
the maps in this set are exactly the same size and
coregistered with each other. The
maps may be viewed individually using your net browser by
simply clicking on the thumbnail of the map. Or you may
download all or any combination of the maps by clicking
on "download TIFF." Stack and/or overlay them
using NIH Image or similar program. Once again, the last
map in this set is the base map for this area that you
can use to create your own additional map layers for this
set.
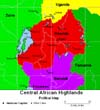 Political Map (download
TIFF) This map shows national boundaries and
principal towns in Rwanda and the surrounding countries.
Although numerous "cities" are shown, most of
them are really only small towns of a few thousand
people. Only the national capitals, Kigali (Rwanda) and
Bujumbura (Burundi), have populations in excess of
100,000, equivalent to a small U.S. city. Thus the urban
population in this region is relatively small, only about
5%. The other 95% live on single family farms or a small
number of larger cooperative farms. This ratio of urban
to rural population is just about the opposite of what it
is in the U.S., where nearly everyone lives in cities.
The black spots marking the locations of the towns in
this map are retained in every map in this set to help
you locate different features. However, town names are
left off the other maps for clarity. Political Map (download
TIFF) This map shows national boundaries and
principal towns in Rwanda and the surrounding countries.
Although numerous "cities" are shown, most of
them are really only small towns of a few thousand
people. Only the national capitals, Kigali (Rwanda) and
Bujumbura (Burundi), have populations in excess of
100,000, equivalent to a small U.S. city. Thus the urban
population in this region is relatively small, only about
5%. The other 95% live on single family farms or a small
number of larger cooperative farms. This ratio of urban
to rural population is just about the opposite of what it
is in the U.S., where nearly everyone lives in cities.
The black spots marking the locations of the towns in
this map are retained in every map in this set to help
you locate different features. However, town names are
left off the other maps for clarity.
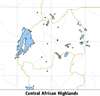
This set closes in on the Virunga
Mountains, which are located between Lake Kivu and the
junction of the national boundaries of Rwanda, Congo, and
Uganda. The Virungas show up well in the topographic map
in this set, so as you look at the information in each of
the other maps in the set, keep your eye on the
information shown for that area to see how it relates to
the regional setting.
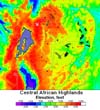 Topography (download
TIFF) This map shows the elevation data for the
Rwanda region. The Virunga Mountains, the highest in this
region, show up as white dots at upper left. Mount
Karisimbi, the highest point, is 4,535 m (14,870 ft)
high, slightly higher than Mount Whitney, the highest
point in the "Lower 48" United States. The
Virungas are actually a chain of volcanoes along the top
of a prominent north-south ridge known as the Congo-Nile
crest: rivers on the west of the crest flow into the
Congo basin (notice the steep drop-off on the west edge
of the map), while rivers on the east eventually turn
northward and flow into the Nile of Egypt. The Congo-Nile
crest forms the east wall of the west branch of the Great
African Rift, a deep valley cutting through the highlands
of Africa that may someday widen into a new ocean. Lakes
Kivu and Tanganyika lie on the floor of the Rift Valley.
Most of Central Rwanda is on a high plateau at an
elevation of 1,220 - 1,830 m (4000 - 6000 ft), while the
eastern section of the country slopes downward to a group
of river valleys at elevations of 915 -1,220 m (3000 -
4000 ft). Topography (download
TIFF) This map shows the elevation data for the
Rwanda region. The Virunga Mountains, the highest in this
region, show up as white dots at upper left. Mount
Karisimbi, the highest point, is 4,535 m (14,870 ft)
high, slightly higher than Mount Whitney, the highest
point in the "Lower 48" United States. The
Virungas are actually a chain of volcanoes along the top
of a prominent north-south ridge known as the Congo-Nile
crest: rivers on the west of the crest flow into the
Congo basin (notice the steep drop-off on the west edge
of the map), while rivers on the east eventually turn
northward and flow into the Nile of Egypt. The Congo-Nile
crest forms the east wall of the west branch of the Great
African Rift, a deep valley cutting through the highlands
of Africa that may someday widen into a new ocean. Lakes
Kivu and Tanganyika lie on the floor of the Rift Valley.
Most of Central Rwanda is on a high plateau at an
elevation of 1,220 - 1,830 m (4000 - 6000 ft), while the
eastern section of the country slopes downward to a group
of river valleys at elevations of 915 -1,220 m (3000 -
4000 ft).
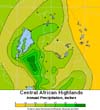 Rainfall (download
TIFF) This map shows the annual precipitation in
inches. Rainfall over the western and central portions of
the region is 40 - 60 in., comparable to that in the
eastern United States. This amount is sufficient to
support agriculture without irrigation, as well as rich
forests and jungles. The zone of highest rainfall is
along the high sections of the Congo-Nile crest. To the
east, however, rainfall decreases so sharply that the
land becomes semidesert. Rain comes during two wet
seasons each year: February to April and November to
January. Even though this region is located just south of
the Equator, the elevation of the Virunga Mountains is
high enough that some of the precipitation falls as snow
and hail. Rainfall (download
TIFF) This map shows the annual precipitation in
inches. Rainfall over the western and central portions of
the region is 40 - 60 in., comparable to that in the
eastern United States. This amount is sufficient to
support agriculture without irrigation, as well as rich
forests and jungles. The zone of highest rainfall is
along the high sections of the Congo-Nile crest. To the
east, however, rainfall decreases so sharply that the
land becomes semidesert. Rain comes during two wet
seasons each year: February to April and November to
January. Even though this region is located just south of
the Equator, the elevation of the Virunga Mountains is
high enough that some of the precipitation falls as snow
and hail.
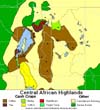 Crops (download
TIFF) This map shows land use in the region. Except
for the areas marked as dense forest, nearly all of the
land is used for subsistence agriculture and grazing. The
areas marked for different cash crops show where these
crops are actually grown. Cash crops, however, never
constitute more than a few percent of all of the crops
grown in a given area. Some 97% of all crops in this
region are food crops, such as bananas, beans, and
potatoes used for local consumption. Still, cash crops,
are very important to the area's economy, supplying well
over half of the export income. The most important cash
crop is coffee, followed by tea and pyrethrum, a natural
insecticide. Crops (download
TIFF) This map shows land use in the region. Except
for the areas marked as dense forest, nearly all of the
land is used for subsistence agriculture and grazing. The
areas marked for different cash crops show where these
crops are actually grown. Cash crops, however, never
constitute more than a few percent of all of the crops
grown in a given area. Some 97% of all crops in this
region are food crops, such as bananas, beans, and
potatoes used for local consumption. Still, cash crops,
are very important to the area's economy, supplying well
over half of the export income. The most important cash
crop is coffee, followed by tea and pyrethrum, a natural
insecticide.
Almost three fourths of the land in
this region is arable (capable of supporting
agriculture), about one fourth is unusable, and the
remainder is used for urban areas and mining. Because of
the high population density,
virtually all of the nonforest arable land in the region
was being farmed by the mid-1980s. This agricultural land
is about evenly split between cultivation and pasturage.
Except for the lowland jungle in the Congo basin in the
west, nearly all of the forest areas left in the region
(about 10% of the total) are in protected national parks.
Much of the remaining forest is arable, however, so there
is pressure from the still rapidly growing population to
convert the remaining forests to planted fields.
Much of the unusable land is located
between Kigali and the lakes on the Rwanda-Tanzania
border. Centuries ago, this land was used for pasture,
but it was damaged by overgrazing and brush fires. In
addition, the lakes are surrounded by swamps in which Tse
Tse flies and mosquitoes breed: the former spread
sleeping sickness to humans and nagana to cattle, while
the latter spread malaria to humans. Consequently, these
lands are now largely unused.
 Rwanda Region Base Map (download
TIFF) This map shows the political boundaries,
rivers, lakes, and towns at the same scale as the other
maps in this set. Use this map to add your own data
leaves to the GIS. Rwanda Region Base Map (download
TIFF) This map shows the political boundaries,
rivers, lakes, and towns at the same scale as the other
maps in this set. Use this map to add your own data
leaves to the GIS.
[ Geographic &
Remote Sensing Information ]
[ Continental
Scale: East Africa ] [ Regional
Scale: Rwanda & Neighbors ]
[ Local Scale: The
Virguna Mountains ] [ Remote Sensing/GIS
Activities ]
[ Glossary
] [ Related
Links ] [ References
] [ PBL
Model ]
[
Home
] [ Teacher
Pages ] [
Modules
& Activities ]
|