|
|
Remote
Sensing/GIS Activities Here is a set of activities you may wish to use as you study the different data sets related to the Virunga Region. 1. GIS Stacks The individual images and maps in the GIS stacks are designed to be stacked together for comparison. This can be done as follows: Stack & Animate Download all of the images you wish to compare into a folder on your hard drive. In NIH Image, use File/Open to select each of the images in the order you wish to stack them. (If you use the Open All option in the dialog box, the images will open in alphabetical order, an order that might not be very useful.) Select Stacks/Windows to Stack. All open images will become part of a "stack" of images that can be quickly flipped to see differences between them. If you have opened an image that is not the same size as the others, you will get an error message. To make a stack, all images must be the same size, so you must either change or close all images that are not the right size. Once you successfully create a stack, one way to see the different leaves is to select Stacks/Animate. The computer quickly and continuously cycles through the stack. Control the speed using the number keys at the top or the right of your keyboard: 1 is slow, 10 is fast. Another way is simply to use the < and > keys to flip back and forth at your own speed. This is probably the best way to study the differences between maps in a stack. A fairly standard way of using leaves of data in a true GIS set is to employ image arithmetic, i.e., take ratios and products of different images in the set to create new leaves showing different parameters. This kind of processing is possible in NIH Image. However, most of the maps in the Continental and Regional stacks are not suitable for image arithmetic in their current formats, so most of the GIS comparisons with these maps will be by visual comparison. However, if you wish to try image arithmetic, do the following: load two images into NIH Image that you wish to compare. (The Rainfall and Crops maps in the Regional stack will give recognizable, if weird-looking, results.) Select Process/Image Math and release. A dialog box appears showing your options. The default option will subtract the first image you loaded from the second. Multiply the result by 0.5 and add 128 to get an image named Result. Click OK and see what you get. Close Result and reselect Process/Image Math. Change the variables in the dialog box using the pull-down menus and see what you get. 2. Overlays and Measurements Most of the images in these GIS stacks were selected or designed to create new GIS leaves by making overlays or composites. The base maps in the Continental, Regional, and Local Scale sections were supplied for use in overlay creation.
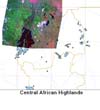
The procedure for creating an overlay/composite is outlined below, but first, here are a few overlays we recommend that you try and make: A. Past Changes in the Gorilla Habitat Overlay either the Virunga Base Map (b/w) or Virunga Base Map (color) from the Local Scale section onto the April 1994 radar image. (Use the Replace option in the Paste Control dialog box.) This will show in detail where national and park boundaries and/or towns and refugee camps are in relation to the forests and volcanoes shown in the images. Compare the forest boundary visible on the image with the location of the boundaries of the national parks to see where and by how much the gorilla habitat has been reduced since the park boundaries were established in 1925. Locate the main refugee camps and determine which portions of the remaining park forest were most likely to be damaged by refugees cutting wood. Look for evidence of different farming techniques around the edges of the parks in the three nations of Rwanda, Uganda, and Congo. Finally, the government of Uganda moved farmers back out of the Mgahinga National Park in 1992. Can you see any evidence of regrowth of the forest in that section of the Virungas? (Highly Recommended) B. Gorilla Habitat Size An important question concerning the survival of the gorillas is how much of the remaining forest can be destroyed or converted to agricultural use before it becomes too small to support the existing gorilla population? This is a difficult question to answer, but an estimate can be made by measuring the sizes of the remaining patches of primitive forest remaining in the Virunga area. The two largest, the Virunga Mountains and the Bwindi Impenetrable Park area, still contain gorillas. Several smaller patches of primitive forest are visible in the April 1994 radar image and this Landsat browse image (download TIFF), but they do not contain any gorillas. Thus the areas of the smaller patches represent a lower limit on the minimum size of a viable gorilla habitat. Use the Freehand Outline tool to measure the areas of these patches. You will need to set scale in the radar image from the Local Scale political map. The width of the Landsat image is about 185 km. Compare your measured areas. The minimum viable gorilla habitat area is somewhere between the areas of the largest patch without gorillas and the area of the smallest patch with gorillas. C. Alternative Park Uses Park lands have been converted to agricultural use in the past due to population pressures. In the 1950s, the Belgian government converted a large section on the southeast side of the park up to an elevation of about 3050m (10,000 ft) to plantations devoted to the cash crop pyrethrum. Ordinary farms now occupy the same area, indicating that the remaining forest land up to a similar elevation around the Virungas could be converted to farms to feed more people. If all of the remaining forest land up to an elevation of 3050m (10,000 ft) were converted to farmland, how many additional people could be supported compared to 600 gorillas? What fraction of the total population of the Virunga area would this represent? Would the remaining forest area be enough to support the gorillas? (See activity 2B) Overlay a contour topographic map of the Virunga Mountains (download TIFF) onto the April 1994 radar image in the Local Scale section. This overlay is not easy; the mountain peaks on the image and map are probably the best reference points to match. The Replace option in the Paste Control dialog box is a good choice for this paste process. In the contour map, the red contour is at an elevation of about 2750 m (9,000 ft), and the contour interval is about 150 m (500 ft). Determine the contour line that best corresponds to the edge of the forest on the southeast side. Use the Freehand Selection tool to outline that contour all the way around the Virunga Mountains. Measure the area. This would be the area remaining in the gorilla habitat if all of the forest below this elevation were converted to agricultural use. Now use the Freehand Selection tool to outline the existing forest and measure the area. The difference between the area inside the contour and the area inside the forest boundary is the area that could be converted to farms. The average size of a family farm in the area is about 3 acres. Assume an average family size of about 8 persons.
Creating an Overlay in NIH Image Start by choosing the image or base map you wish to paste the other image(s) onto. Select two features common to both the base and the image(s) to be pasted (shorelines are good because of the high contrast between water and land in most images). Use the Line Selection tool to measure the distance in pixels between the both features on each image. Calculate the ratio of the distance between the features on the base map to the distance on each image to be pasted. If the image is turned relative to the base map, estimate the angle of rotation clockwise or counterclockwise. Record these values somewhere (like a handy piece of paper) for each image to be pasted. Now select the image to be pasted by clicking on it. Use any of the area selection tools to select the portion of the image you want to paste or double click on the Rectangular Selection tool to select the whole image. Now select Edit/Scale and Rotate. A dialog box will appear. Type the ratio of the distances into the Horizontal Scale box (the number you type will automatically appear in the Vertical Scale box), then type in the estimated angle of rotation (a positive angle will rotate clockwise, a negative angle will rotate counterclockwise). Try Nearest Neighbor as the Interpolation Method, put a cross in the New Window box, and click OK. A new image window will appear with the properly scaled image. Since the linear scales in both the base map and the new (rescaled) image are the same, the two may now be combined by cutting and pasting. (You might want to try some of the other options in the Scale and Rotate dialog box to see what you get. By typing in different ratios for the Vertical and Horizontal scales, and different numbers for the Angle, you can distort the original image in any number of ways!) Cut and Paste Select the entire rescaled image by double clicking on the Rectangular Selection tool. Select Edit/Copy Selection. Your selection will be copied to an internal memory file called the Clip Board. (Note: The Edit/Copy command will leave your original image untouched; the Edit/Cut command will remove the selected piece and leave a blank space.) Now click on, or use the Window menu to select, the base map you wish to transfer the copied (cut) piece onto. (Note: If the target image is anything but a new or blank image file, make sure you save the original somewhere.) Now select Edit/Paste. A copy of the selected piece will pasted onto the target image. You can click and drag the pasted piece to move it around for placement as long as you do not click on the map outside the pasted piece or select another tool. When you have moved the pasted piece to the location you want it, click outside of the piece or select another tool to fix it in place. It is now a permanent part of the image. If you made a mistake or don't want the pasted piece, select Edit/Undo Paste before you fix the pasted piece. If you inadvertently fixed the piece you want to get rid of, the only thing you can do is select File/Revert to Saved to bring back the original base map. (If the pasted piece is the wrong size or angle, select Edit/Undo Paste and redo the Edit/Scale and Rotate steps. You can use the Angle Measuring tool to measure the difference in the pasted image, but then you must then restore the original base.) There are several ways to combine a selected piece with the base map. Once you paste the selected piece, but before you fix it, select Windows/Show Paste Control. A small dialog box will appear with the paste options. The options can be found in a small pull-down menu on the left side of the dialog box. The default Copy transfer mode simply replaces the pixel values in the target map with the pixel values of the pasted piece. The other Transfer Mode options allow different types of transparent pastes, where the original image may be seen in different forms under the pasted piece. To see the effect of the different paste modes, simply select a mode and release; the pasted piece will change in appearance. You can change the Transfer mode as many times as you like as long as you do not fix the pasted piece. The mode you select will depend on the type of images being combined and the appearance you want for the final combined image. Remember: Never select Save Changes when closing a saved image or you will wreck your saved image. Before saving, always rename a new composite image you wish to keep.
[ Geographic &
Remote Sensing Information ] [ Home ] [ Teacher Pages ] [ Modules & Activities ] |
![]()
HTML code by Chris Kreger
Maintained by ETE Team
Last updated April 28, 2005
Some images © 2004 www.clipart.com
Privacy Statement and Copyright © 1997-2004 by Wheeling Jesuit University/NASA-supported Classroom of the Future. All rights reserved.
Center for Educational Technologies, Circuit Board/Apple graphic logo, and COTF Classroom of the Future logo are registered trademarks of Wheeling Jesuit University.
 The
idea of an overlay is illustrated by the image at left (
The
idea of an overlay is illustrated by the image at left (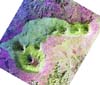 D. Create Your Own Stack Scale and rotate the MSS, Thematic Mapper, and
radar images of the Virungas, and the vegetation map from
the Rutgers Gorilla Project (all found in the Local Scale
section) to create your own
D. Create Your Own Stack Scale and rotate the MSS, Thematic Mapper, and
radar images of the Virungas, and the vegetation map from
the Rutgers Gorilla Project (all found in the Local Scale
section) to create your own