|
|
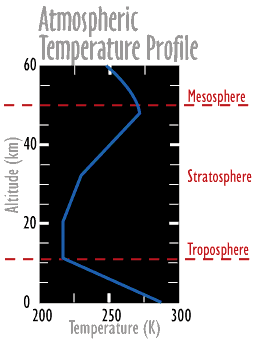
Meteorology of Ozone The troposphere and the stratosphere are the two lowest layers of the atmosphere. The troposphere is the layer next to Earth's surface. On the average, it extends 11 km to the top of the troposphere which is called the tropopause. In the troposphere, the temperature generally decreases with altitude. The reason is that the troposphere's gases absorb very little of the incoming solar radiation. Instead, the ground absorbs this radiation and then heats the tropospheric air by conduction and convection. Since this heating is most effective near the ground, the temperature in the troposphere gradually decreases with increasing altitude until the tropopause is reached. This is the beginning of the stratosphere. In the stratosphere, the temperature remains isothermal until about 20 km. Then a strange thing happens--the temperature actually begins to increase with altitude. From a temperature of about -56.5C at 20 km, it increases to -2.5C at 50 km.
The reason for this temperature fluctuation is that ozone absorbs the uvb radiation in the lower atmosphere. Higher in the atmosphere, however, normal diatomic oxygen absorbs the uvc radiation. Once it is absorbed, it is reradiated at different wavelengths, thereby warming the stratosphere. At the top of the stratosphere (about 50 km, the stratopause), the temperature begins to decrease again as the altitude increases. Above the stratopause, in the mesosphere, thermosphere, and exosphere harmful gamma rays and X-rays are absorbed. Chart: NASA Atmospheric Ozone Chart. The circulation of the atmosphere is very complex and has many causative factors. The amount of solar radiation reaching the ground varies due to latitude, time of year, and cloud cover. Specific heat capacities for different surface materials vary greatly. Additionally, the Coriolis force, which results from the rotation of Earth, influences the movement of air. The net effect of these factors is the transporting of ozone from the tropics, where most ozone is formed, to the mid and higher latitudes. Of course, because of variations around Earth, the ozone movement is not uniform, and at a given latitude, there will be variations in concentrations. Since ozone is produced and transported in the stratosphere, some understanding of the structure and circulation of the stratosphere is needed. The meridional circulation, or the circulation along longitude lines, shows rising stratospheric air in the tropics, which descends at middle and higher latitudes. Ozone is transported by this flow.
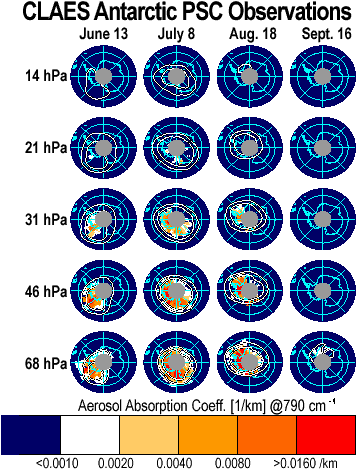
Another important feature of the stratosphere is the cold pool of air that forms at high latitudes during the winter. This cold air is centered in the lower stratosphere at about 25 km. During the Southern Hemisphere winter air can reach temperatures colder than -90C near the South Pole. In the Northern Hemisphere, the lowest temperatures reach about -65C. CLAES Temperature Data As a result, a zone of strong westerly winds (or vortex) forms and surrounds each pole. Because the temperature contrast is greatest in the vicinity of the South Pole, the vortex that forms there during the Southern Hemisphere winter is considerably stronger than the vortex that forms during the Northern Hemisphere winter. One consequence of the very cold temperatures of the stratosphere near the South Pole is the formation of two types of polar stratospheric clouds (PSC). One consists of pure water ice. Although the air contains very little moisture, at very low temperatures even these small amounts can produce ice crystal-containing clouds through the process of sublimation (deposition). The other and more common type is composed of a hydrated form of nitric acid (HNO3): the nitric acid molecules are attached to water molecules. Reactions in these clouds convert stable forms of chlorine to Cl2which readily dissociates under the influence of sunlight and destroys ozone. These reactions also remove gaseous HNO3. The result is almost total destruction of ozone within the lower stratosphere at altitudes of about 14 to 19 km. Under sunlit conditions, HNO3 undergoes photolysis, and releases NO2. The NO2 then reacts with ClO, removing it from reactions with ozone. Because of the very cold temperatures required for the formation of PSCs, the peak probability of occurrence in the Northern Hemisphere is only about 10% in early February. In the Southern Hemisphere, they are a yearly occurrence, although their spatial extent and temporal duration vary.
This figure shows where the PSCs can be expected. Frequently, vertical positions in the atmosphere are referenced by atmospheric pressure. Hectopascals are the normal units used. Greatest occurrence is at a pressure of 68 hPa (hectopascals), and an altitude of slightly less than 19 km. The lowest pressure shown is 14 hPa, about 29 km. [ Atmospheric Physics ] [ Atmospheric Chemistry ] [ Meteorology of Ozone ] [ Home ] [ Teacher Pages ] [ Modules & Activities ] |
![]()
HTML code by Chris Kreger
Maintained by ETE Team
Last updated April 28, 2005
Some images © 2004 www.clipart.com
Privacy Statement and Copyright © 1997-2004 by Wheeling Jesuit University/NASA-supported Classroom of the Future. All rights reserved.
Center for Educational Technologies, Circuit Board/Apple graphic logo, and COTF Classroom of the Future logo are registered trademarks of Wheeling Jesuit University.
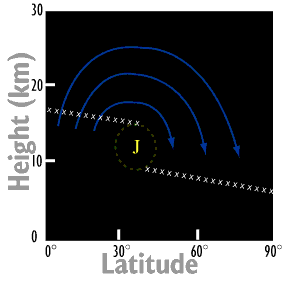 Right: Transport of
ozone depicted by curved blue line. JETSTREAM location indicated by J. "Figure
12.5" from An Introduction to Dynamic Meteorology. Third Edition (by Dr. James
Holton, 1992. vol. 48 in the International Geophysics Series, page 412.)
Right: Transport of
ozone depicted by curved blue line. JETSTREAM location indicated by J. "Figure
12.5" from An Introduction to Dynamic Meteorology. Third Edition (by Dr. James
Holton, 1992. vol. 48 in the International Geophysics Series, page 412.)