 |
Forest Fragmentation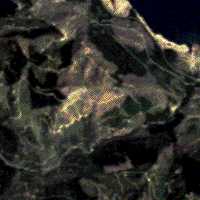 Simply measuring the area of old-growth
forest remaining in a logged zone does not give a complete picture of the effects of
clear-cutting on the ecology of the remaining forest. The size and shape of the clear-cuts
and of the remaining pieces of forest are also important. For example, large clear-cuts
tend to increase erosion. Further, many species of animals and plants cannot survive near
a forest edge. Such species will disappear from a forest that has been cut so that only
small, disconnected pieces remain, or that has been cut "swiss cheese" style--a
large patch of forest containing many holes separated only by narrow corridors. The
northern spotted owl is such a species and needs large tracts of intact forest to survive.
The process of cutting a large forest into a number of smaller pieces is called forest
fragmentation. Left: This image
shows a highly fragmented forest on the south shore of Lake Keechelus. The bright lines
are logging roads. Bare soil shows in orange and yellow tones, mostly on steep slopes. Image: S. K. Croft. Raw TM scene
#Y5308418181X0. These data are distributed by the EROS Data Center Distributed Active
Archive Center (EDC DAAC), located at the U.S. Geological Survey's EROS Data Center in
Sioux Falls, SD. Simply measuring the area of old-growth
forest remaining in a logged zone does not give a complete picture of the effects of
clear-cutting on the ecology of the remaining forest. The size and shape of the clear-cuts
and of the remaining pieces of forest are also important. For example, large clear-cuts
tend to increase erosion. Further, many species of animals and plants cannot survive near
a forest edge. Such species will disappear from a forest that has been cut so that only
small, disconnected pieces remain, or that has been cut "swiss cheese" style--a
large patch of forest containing many holes separated only by narrow corridors. The
northern spotted owl is such a species and needs large tracts of intact forest to survive.
The process of cutting a large forest into a number of smaller pieces is called forest
fragmentation. Left: This image
shows a highly fragmented forest on the south shore of Lake Keechelus. The bright lines
are logging roads. Bare soil shows in orange and yellow tones, mostly on steep slopes. Image: S. K. Croft. Raw TM scene
#Y5308418181X0. These data are distributed by the EROS Data Center Distributed Active
Archive Center (EDC DAAC), located at the U.S. Geological Survey's EROS Data Center in
Sioux Falls, SD.As you can see in the Landsat image of the Rainier area and on your land-use map, forests are shaped by clear-cutting into a number of different geometric configurations: small isolated patches, sets of patches joined at corners, large patches with holes clear-cut within them, and large continuous areas. Three different styles of clear-cutting are shown in detail in the enlargements of Boxes A, B, and C in the true-color Landsat image in the Virtual Ground Truthing section. Area A is now all national forest land but was originally alternating sections of private and public land. The private lands were clear-cut, the public lands were not. Area B is also within a national forest; the clear-cuts are recent. Area C is private land; the remaining forest is not old growth, but regrown forest. You can use these enlargements to analyze the different styles of clear-cutting in more detail. Download and save TIFF versions of the three areas: AreaA, AreaB, AreaC. With these images, you can try the following: A. Compare clear-cut sizes. Following the method outlined in the Virtual Ground Truthing section, outline the clear-cuts and create a black-and-white map. Use the bucket tool to color all of the clear-cuts the same color. Use the Density Slice option and select the clear-cuts. Select Analyze/Options and select Area; deselect all other options. Now select Analyze/Analyze Particles. In the dialog box that appears, select Label Particles, Outline Particles, and click OK. NIH Image will automatically number, outline, and calculate the area of each clear-cut. Select Analyze/Show Results to see the computed data. Using a calculator, calculate the average area of the clear-cuts in the image. Repeat for all three images and compare differences among the three areas. B. Compare forest fragmentation patterns. Again, create a black-and-white map of each of the three areas, only this time outline the remaining forest sections. What to outline will be obvious in area A, but a little trickier and more subjective in areas B and C since the forest in these areas just has holes cut in it. To estimate the size of the forest sections in areas B and C, outline intact sections of forest--sections of forest with no interior holes--by outlining the large sections of forest and drawing boundaries across the narrow necks or corridors of forest where clear-cuts come close together. Thus, a single, "lumpy," doughnut-shaped section of forest might be broken down into two or three lumps with no interior holes. Once this is done, create a black-and-white map and color all of the forest sections a single color. Use the Density Slice option to select the sections. Select Analyze/Options and select Area, Perimeter, and deselect all other options in the dialog box. Now select Analyze/Analyze Particles. In the dialog box that appears, select Label Particles, Outline Particles, and click OK. NIH Image will automatically number, outline, and calculate the area and perimeter of each forest section. Select Analyze/Show Results to see the computed data. Use a calculator to calculate the average area of the forest sections in each image. Compare differences among the three areas. As an example of how the clear-cutting in each area may have affected wildlife, compare your calculated average forest areas with the following graph, which shows a representative reduction of songbirds in a fragmented forest as a function of the size of the remaining forest sections. Although this graph is only for one type of wildlife, songbirds, it is representative of the type of ecological change that occurs when a forest environment is changed.
This graph shows the chance of encountering songbirds that live
in dense forests as a function of the size of the forest. The graph is adapted from data
shown in Robinson, S. K. (1997). The case of the missing songbirds. Consequences,
3:1, 3-15. [ Viewing Forests from Space ] [ Virtual Ground Truthing ] [ Home ] [ Teacher Pages ] [ Modules & Activities ] |
![]()
HTML code by Chris Kreger
Maintained by ETE Team
Last updated November 10, 2004
Some images © 2004 www.clipart.com
Privacy Statement and Copyright © 1997-2004 by Wheeling Jesuit University/NASA-supported Classroom of the Future. All rights reserved.
Center for Educational Technologies, Circuit Board/Apple graphic logo, and COTF Classroom of the Future logo are registered trademarks of Wheeling Jesuit University.