
|
|
Risk Analysis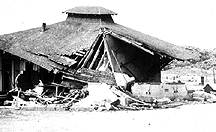 This rather thorny term,
"risk analysis," camouflages a seemingly esoteric subject that hits virtually
every American right where it hurts most--in the pocketbook! Risk analysis is the study of
the chance of a damaging or life-threatening event happening in your life this very day.
Fire! Flood! Theft! Earthquakes! Car accidents! Rabid T-Rex attacks! What are your
chances today? Photo: Courtesy
of NGDC/NOAA This rather thorny term,
"risk analysis," camouflages a seemingly esoteric subject that hits virtually
every American right where it hurts most--in the pocketbook! Risk analysis is the study of
the chance of a damaging or life-threatening event happening in your life this very day.
Fire! Flood! Theft! Earthquakes! Car accidents! Rabid T-Rex attacks! What are your
chances today? Photo: Courtesy
of NGDC/NOAAThe basic ideas of risk analysis are quite simple, but the application can be quite complicated depending on the risk evaluated. But don't let that stop you! Insurance agents know all about risk analysis, since that is how they decide how much you will pay for insurance, and they are just normal people like you. To give you an idea of what's involved, let's look at a simple example: auto insurance premiums. The total cost an insurance company has to cover each year for a particular type of accident is computed as follows: Total Cost = (Cost of each accident) x (# Accidents per year) The number of accidents per year refers to the total number of accidents experienced by the group of people insured by the company. The actual number of accidents within a given group of people will, of course, change somewhat from year to year. So to get a good estimate of the average yearly cost, an insurance company will simply count the number of accidents for the group over an interval of several years and then divide the total number of accidents by the number of years. The resulting number per year is called the probability of occurrence for the particular accident. To break even, the insurance company must collect the Total Cost from the group. So your annual premium, or the cost per person in the group to cover that particular accident, is:
Your premiums will actually be slightly larger (a few %) so that the company can make a small profit. We have considered only the cost of a single type of accident, but everyone knows that there are many different kinds of accidents--from small fender-benders, costing a few hundred dollars to repair, to large, car-totaling crashes, costing tens of thousands of dollars to settle. So a more realistic way of thinking about your premiums is to think of the total cost of accidents as a sum like: (the cost of small accidents times number of small accidents) + (cost of large accidents times the number of large accidents) and so on. When you take a "deductible," you are saying that you will pay for any accidents you have costing less than a certain amount. Since you pay for one type of accident, the total cost to the insurance company is less, so the premium you pay is less. You should also realize that different kinds of accidents have different probabilities of occurrence. For instance, experience shows that minor wrecks occur more often than large ones, so the probability of a large wreck is smaller than the probability of a minor wreck. The number of accidents also depends on the type of people in a group. In general, high school students have more accidents per person than their parents, so the students' premiums are larger than their parents'. Just for comparison, here are the chances of a few types of interesting events occurring in your life this year:
Note that these numbers are national averages. They will be somewhat different depending on where you live, how old you are, whether or not you smoke or exercise, whether you like to golf during thunderstorms, and which airline you choose. On the other hand, there are some useful comparisons. For example, you are about 1,000 times more likely to be killed on the way to the airport than to die during the airplane flight. You are about 10,000 times more likely to die from any cause or to have your car stolen than to win a lottery. Now let's apply risk analysis to natural hazards. How do you estimate the annual probability of an occurrence of a particular type of natural disaster--especially of disasters that don't happen every day? In just the same way as above: count the number of the type of event over an interval of time and divide the sum by the number of years in the interval. For example, based on geologic evidence, the 14 Cascade volcanoes have erupted 50 times in the last 4000 years. So the probability of eruption for any given volcano in the Cascades in any given year is 50/[(14)(4000)], or about 1 in a thousand (10-3) per year. This translates into about 1 or 2 eruptions among the 14 Cascade volcanoes each century. All of these 50 eruptions were relatively small ones -- even the 1980 eruption of Mount St. Helens! However, there is geologic evidence of eruptions more than 100x larger than Mount St. Helens in the Cascades. How often do these very large eruptions occur? The data are
Four eruptions in about a million years. This implies a probability of eruption of about 1 in 250,000 per year. Now, how accurate is this estimate? We must be careful because the so-called "statistics of small numbers" can be very misleading. In statistics, we are looking for typical events, not unique ones. If we looked at only the last 10,000 years, we would find only one event: the Mazama eruption. If we assumed the Mazama eruption to be typical, a simple calculation gives an annual probability of eruption of 1 in 10,000 ("Aaaaaaahhh! We're all gonna' die!"). But what if the Mazama eruption was unique? A one-shot deal? Then there would be no giant eruptions in the future, and the actual probability of eruption would be zero ("No worries, Mate!"). Which is right? Unfortunately there is no way to tell whether a single event is unique or not. The best that we can do to find out is to try to find other similar events. We obtained our list of four events by expanding the time period of our search to over 200 times as long as the period considered for the smaller eruptions. Four is still not a large number for statistical analysis, but it is better than one. Not only that, but one of the eruptions, Long Valley, is not even in the Cascades, only nearby. It may or may not be affected by the conditions driving large eruptions in the Cascades. Let's look at what we have. On the one hand, there have been more than one Mazama-scale eruption in the Cascades. Thus Mazama is not unique and the probability of eruption is greater than zero. On the other hand, the 1 in 10,000 probability we calculated considering Mazama as typical would predict about 100 Mazama-scale eruptions less than a million years old in the Cascades. There are actually only (at most) four. Consequently, in the absence of additional data, we can accept the 1 in 250,000 eruption probability as approximately correct, but we must also recognize the uncertainty in that number and the need to gather additional data if possible. One more point: if we compare the probability of small Cascade eruptions with the probability of large eruptions, we find that small eruptions are much more likely than large ones. This result is consistent with much experience in dealing with many other types of natural phenomena (earthquakes, hurricanes, tornadoes, floods, etc.): large events are much less probable than small events of the same kind. Since the extreme conditions required to bring about extreme events are unusual in themselves and usually require enormous concentrations of energy, these types of events are difficult to achieve.
[ Risk Analysis ] [ Mount Vesuvius ] [ Home ] [ Teacher Pages ] [ Modules & Activities ] |
![]()
HTML code by Chris Kreger
Maintained by ETE Team
Last updated September 30, 2010


Discuss Exploring the Environment!
Some images © 2004 www.clipart.com.
Privacy Statement and Copyright © 1997-2004 by Wheeling Jesuit University/NASA-supported Classroom of the Future. All rights reserved.
Center for Educational Technologies, Circuit Board/Apple graphic logo, and COTF Classroom of the Future logo are registered trademarks of Wheeling Jesuit University.