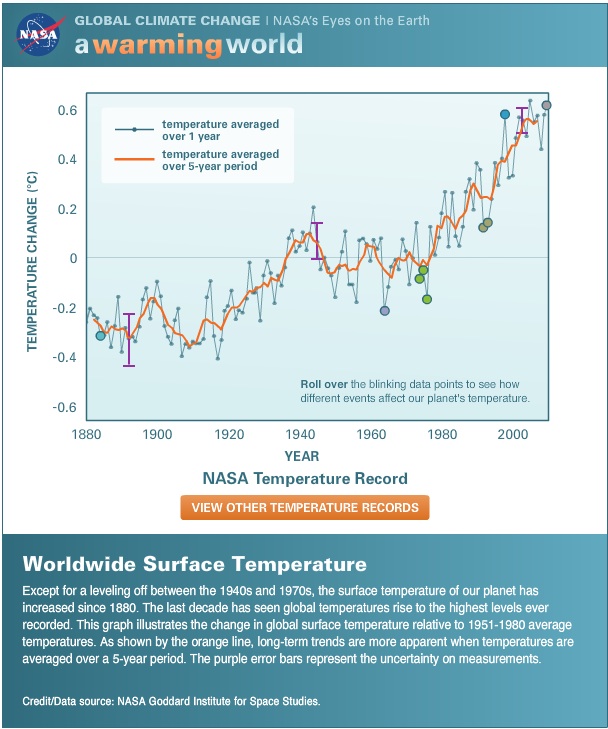
Global Temperatures
Temperature Anomalies
 When researching global climate changes and temperature data, you will often read about the “temperature anomaly.” That is the difference between the long-term average temperature (sometimes called a reference value) and the temperature that is actually occurring. In other words, the long-term average temperature is one that would be expected; the anomaly is the difference between what you would expect and what is happening.
A positive anomaly means that the temperature was warmer than normal; a negative anomaly indicates that the temperature was cooler than normal.
Why use temperature anomalies and not the actual temperature measurements? Actual temperature measurements are often difficult to gather. Some areas in the world have few temperature measurement stations (for example, remote jungles and deserts), and temperatures must be estimated over large regions.
Using anomalies, the departure from an “average,” allows more accurate descriptions over larger areas than actual temperatures and provides a frame of reference that allows easier analysis. You will use anomalies in many of the table and graphs presented in the Data Resource Center.
Activity Practice for Analyzing Data
Look at the table below. The table lists temperature anomalies for different environments (land, ocean, and land and ocean combined) globally and for the Northern and Southern Hemispheres. This table provides some interesting data. Take a closer look and answer the questions below to help you in your temperature analysis:
- Do the temperature anomalies tend to be positive (warmer than normal) or negative (cooler than normal)?
- Globally, which environments have warmer anomalies? Which have cooler anomalies?
- In the Northern Hemisphere which environments have warmer anomalies? Which have cooler anomalies?
- In the Southern Hemisphere which environments have warmer anomalies? Which have cooler anomalies?
- Generally, describe how 2010 ranks out of 131 years of temperature data.
- Generally, describe when the next warmest year for the different environments occurred. Did they occur decades ago or more recently?
- What conclusions do you make from this table concerning global warming?
Temperature Rankings and Anomalies
|
January-August 2010 |
Anomaly |
Rank (out of 131 years) |
Warmest/Next Warmest Year on Record |
Global |
|||
|
Land |
+1.04°C (+1.87°F) |
1st warmest |
2007 (+1.02°C/1.84°F) |
|
Ocean |
+0.53°C (+0.95°F) |
2nd warmest |
1998 (+0.56°C/1.01°F) |
|
Land and Ocean |
+0.67°C (+1.21°F) |
1st warmest |
2002 (+0.62°C/1.12°F) |
Northern Hemisphere |
|||
|
Land |
+1.14°C (+2.05°F) |
2nd warmest |
2007 (+1.22°C/2.20°F) |
|
Ocean |
+0.55°C (+0.99°F) |
1st warmest |
2005 (+0.54°C/0.97°F) |
|
Land and Ocean |
+0.77°C (+1.39°F) |
1st warmest |
2007 (+0.73°C/1.31°F) |
Southern Hemisphere |
|||
|
Land |
+0.78°C (+1.40°F) |
3rd warmest |
2005 (+0.86°C/1.55°F) |
|
Ocean |
+0.53°C (+0.95°F) |
2nd warmest |
1998 (+0.60°C/1.08°F) |
|
Land and Ocean |
+0.57°C (+1.03°F) |
2nd warmest |
1998 (+0.63°C/1.13°F) |


