

Global Temperatures
The Carbon Cycle: Sources and Sinks
Compounds that contain the element carbon are referred to as "organic." They are present in all living things. Carbon is continually moving among Earth's lithosphere, hydrosphere, biosphere, and atmosphere in various forms: as carbon dioxide (CO2) in the atmosphere, sugars or carbohydrates (CnH2nOn) in living organisms, and calcium carbonate (CaCO3) in rocks and minerals, to name just a few. The movement of carbon among Earth's spheres, as diagrammed below, is known as the carbon cycle.
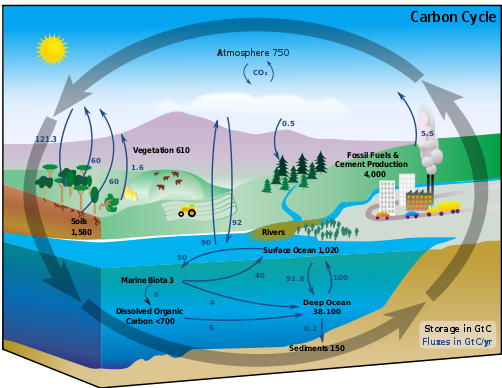
The black numbers in the diagram indicate how much carbon is stored in carbon sinks (areas of storage) in billions of tons (gigatons—GtC). The arrows show how carbon moves among Earth’s spheres.
Green plants play a very important role in the carbon cycle. They absorb carbon dioxide (CO2) from the atmosphere and produce carbon-containing sugars. This process is called photosynthesis. There are two main steps in photosynthesis. First, plants trap the sun's light energy in a compound called chlorophyll. This energy is converted to a chemical form called adenosine triphosphate (ATP). In the second step plants use the energy from ATP to produce sugar (C6H1206). The process of photosynthesis requires water (H2O). It also produces water as well as oxygen (O2). The net chemical reaction for the process of photosynthesis is
6 CO2 + 6 H2O + sunlight ------> C6H12O6 + 6 O2.
Animals eat plants to obtain the energy trapped during photosynthesis. As the animals' bodies break down the carbohydrates in the plant tissue, CO2 is released to the atmosphere. This process is called respiration. The net chemical reaction for the process of respiration is the exact opposite of photosynthesis: 6 O2 + C6H12O6 ------> 6 H2O + 6 CO2. Plants respire also as they break down the organic molecules in themselves in order to release the stored energy. Plants and animals also release CO2 to the atmosphere when they decay.
When dead plants and animals slowly decay under high pressure and high temperatures, they may eventually form pools of energy known as fossil fuels. Coal, oil, and natural gas are fossil fuels. People burn fossil fuels to release the energy stored in them. The energy is used for heat, operating automobiles, etc.
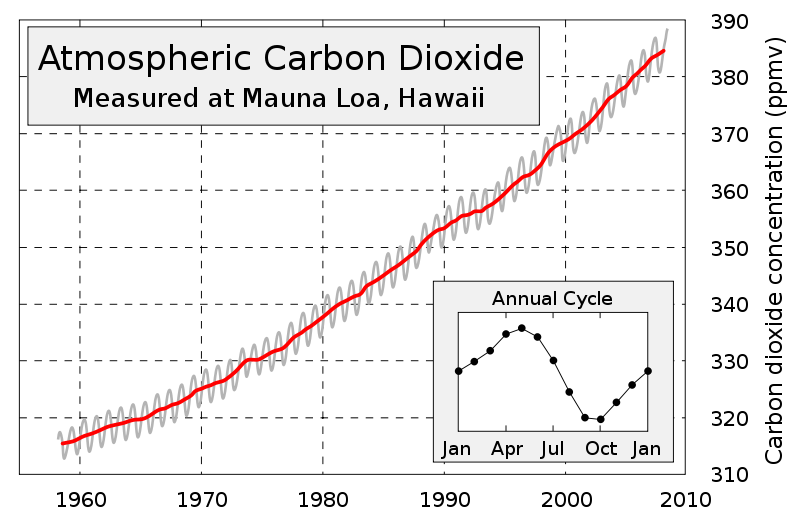
Since the Industrial Revolution humans have burned increasingly greater amounts of fossil fuels in order to produce more energy. As the practice of burning fossil fuels grows, so does the amount of carbon dioxide emitted to the atmosphere. Historical data from ice cores and modern data collected from the Mauna Loa Observatory in Hawaii support this.
Source: http://en.wikipedia.org/wiki/Global_climate_change
As a greenhouse gas, CO2 increases the rate of global climate change. This is because CO2 contributes so greatly to the greenhouse effect. The sets of graphs below show carbon dioxide variations over thousands of years. Data was collected from various sources, such as ice core sampling. Further below is a graph comparing CO2 and temperature levels over thousands of years. Do you see a distinctive pattern across the data visualizations presented?


This figure of temperature and carbon dioxide is from the Marian Koshland Science Museum: Variations of Northern Hemisphere Surface Temperature and Carbon Dioxide. Additional information: The image and text excerpt below are from a website by RickyRoad, a faculty member at U Michigan and who leads a course on climate change problem solving.
"In this figure there are variations in the temperature field that are not present in the carbon dioxide field. Scientific rigor requires that we investigate this variability, and with some confidence we can attribute the variability prior to about 1800 to volcanic activity and changes in the sun. There is no doubt that the further back we go from the present time, the greater the uncertainty. We, today, have much better observations of temperature, of solar variability, of volcanic activity, of carbon dioxide; we have better measurements of every quantity. Does the fact that we have better measurements today devalue the knowledge from the past? Change it?" --Ricky Road
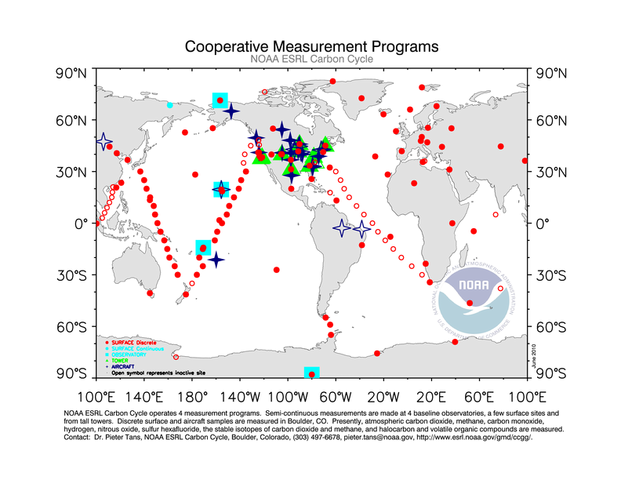
There are many cooperative programs around the world that monitor carbon dioxide emissions, sources, and sinks.
 Source: Earth System Research Laboratory—Global Monitoring Division, http://www.esrl.noaa.gov/gmd/Photo_Gallery/GMD_Figures/ccgg_figures/tn/ccggmap.png.html
Research stations and observatories measure atmospheric carbon dioxide as well as other greenhouse gases, such as methane, carbon monoxide, hydrogen, nitrous oxide, and sulfur hexafluoride. The data obtained from these stations and sites are invaluable contributions to the science of global climate change.
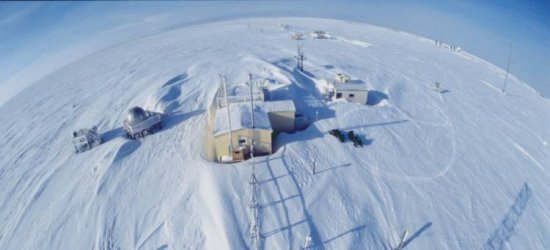
Barrow, AK, Observatory (BRW) is located on the northernmost point of the United States. Source: http://www.esrl.noaa.gov/gmd/obop/brw/
U.S. Climate Reference Network climate observing station on Mauna Loa in Hawaii (Mauna Kea in the background).
Image source: NOAA Satellite and Information Service: http://www.ncdc.noaa.gov/oa/wdc/index.php
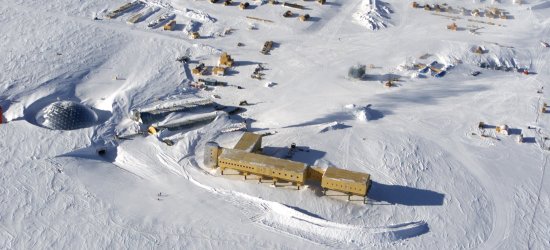
The South Pole Observatory (SPO) is located at the geographic South Pole on the Antarctic plateau. Source: http://www.esrl.noaa.gov/gmd/obop/spo/
The Mauna Loa Observatory in Hawaii, run by the National Oceanic and Atmospheric Administration (NOAA) is known for its research on atmospheric carbon dioxide concentration.

