
|
Continental
Scale: East Africa
This GIS
set gives information about various aspects of Central
and East Africa. All of the maps in this set are exactly
the same size and coregistered with each other. This
means that they can be overlaid onto each other for
comparison, and all of the boundaries and coastlines will
match. Thus each map is a "layer" in the GIS
set. The maps may be viewed
individually using your net browser by simply clicking on
the thumbnail of the map. Or, if you wish, you may
download all or any combination or all of the maps by
clicking on "download TIFF." Stack and/or
overlay them using NIH Image or a similar program. This
will enable you to compare information for a given
location on all of the maps more easily. The last map in
this set is the base map for this area that you can use
to create your own additional map layers for this set.
 Political Map (download
TIFF) This map shows national boundaries and capital
cities of the nations in Central and East Africa.
Latitude and longitude are shown in degrees on the
borders of the map. The Virunga Mountains are located at
the intersection of Rwanda (in red), Congo (in bright
green), and Uganda (in yellow) at lower left center. As
you look at the information in each of the other maps,
keep your eye on the information shown for that area to
see how it relates to the broader picture. Political Map (download
TIFF) This map shows national boundaries and capital
cities of the nations in Central and East Africa.
Latitude and longitude are shown in degrees on the
borders of the map. The Virunga Mountains are located at
the intersection of Rwanda (in red), Congo (in bright
green), and Uganda (in yellow) at lower left center. As
you look at the information in each of the other maps,
keep your eye on the information shown for that area to
see how it relates to the broader picture.
 Population (download
TIFF) This map shows population
density in East Africa and the Virunga region. The
population densities indicated by the purplish and
reddish tones are comparable to the highest population
densities in the world, similar to the suburban and
developed agricultural areas around the great cities of
the American East and Midwest. Population (download
TIFF) This map shows population
density in East Africa and the Virunga region. The
population densities indicated by the purplish and
reddish tones are comparable to the highest population
densities in the world, similar to the suburban and
developed agricultural areas around the great cities of
the American East and Midwest.
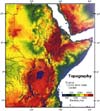 Topography (download
TIFF) This map presents elevation data for Central
and East Africa. Inland lakes are shown in deep blue.
Notice the deep Nile Valley (upper center) and the
highlands along the African Rift system, which extends
from Ethiopia (upper right center) southeast through
Kenya, Rwanda, and Tanzania. Africa's highest mountains
are in this area. Topography (download
TIFF) This map presents elevation data for Central
and East Africa. Inland lakes are shown in deep blue.
Notice the deep Nile Valley (upper center) and the
highlands along the African Rift system, which extends
from Ethiopia (upper right center) southeast through
Kenya, Rwanda, and Tanzania. Africa's highest mountains
are in this area.
 Climate (download
TIFF) A wide range of climates are found in this part
of Africa. The color key, which you will be able to see
clearly if you click on the thumbnail, shows the
following. Equatorial: hot, humid, and wet all of the
time. Tropical rain forests with all their incredible
plant, animal, and insect life are found here. Humid
Tropical: hot, wet, with short dry seasons. Tropical/Long
Dry: warm/hot, wet, but with long dry seasons. Sahelian:
warm/hot, dry, with occasional rains. Vegetation is
semiarid steppe. Desert: hot and dry. Vegetation is
sparse to nonexistent in central desert areas.
Mediterranean: warm, moist, with dry, mild summers.
Highland: variety of wet to dry climates with
temperatures and humidities lowered by altitude. Even in
highland areas with low rainfall, the lower temperatures
reduce evaporation to allow more intense farming. The
lower temperatures and humidities make such climates more
pleasant for humans and animals by making the air more
comfortable and by reducing insect populations so common
in lower wetter climates. Climate (download
TIFF) A wide range of climates are found in this part
of Africa. The color key, which you will be able to see
clearly if you click on the thumbnail, shows the
following. Equatorial: hot, humid, and wet all of the
time. Tropical rain forests with all their incredible
plant, animal, and insect life are found here. Humid
Tropical: hot, wet, with short dry seasons. Tropical/Long
Dry: warm/hot, wet, but with long dry seasons. Sahelian:
warm/hot, dry, with occasional rains. Vegetation is
semiarid steppe. Desert: hot and dry. Vegetation is
sparse to nonexistent in central desert areas.
Mediterranean: warm, moist, with dry, mild summers.
Highland: variety of wet to dry climates with
temperatures and humidities lowered by altitude. Even in
highland areas with low rainfall, the lower temperatures
reduce evaporation to allow more intense farming. The
lower temperatures and humidities make such climates more
pleasant for humans and animals by making the air more
comfortable and by reducing insect populations so common
in lower wetter climates.
 Soil Suitability (download
TIFF) This map shows the percentage of land that can
potentially be used for agriculture assuming rainfall is
the only source of water. This simple data format really
hides a very complex combination of many different types
of data, including soil type, chemistry, suitability for
regional crops, and local climate. For example, the lack
of suitable soils in the brown areas of the map may be
due to lack of rainfall, poor soil, extreme temperatures,
or any combination of problems. More details about these
data can be obtained from the Home page of the Greater
Horn of Africa Project. Soil Suitability (download
TIFF) This map shows the percentage of land that can
potentially be used for agriculture assuming rainfall is
the only source of water. This simple data format really
hides a very complex combination of many different types
of data, including soil type, chemistry, suitability for
regional crops, and local climate. For example, the lack
of suitable soils in the brown areas of the map may be
due to lack of rainfall, poor soil, extreme temperatures,
or any combination of problems. More details about these
data can be obtained from the Home page of the Greater
Horn of Africa Project.
 Land Use - Crops (download
TIFF) This map shows the percentage of land actually
used for agriculture. It shows land used for dry,
rain-fed, and irrigated farming. Thus this map shows
actual land use in spite of problems, such as lack of
rain or alkaline soil, while the Soil Suitability map
shows the potential for farming without technological
aids, such as mechanized irrigation systems or chemical
fertilizers. This is an important distinction, because
the technology that would allow use of more land usually
requires large amounts of money that ordinary people and
even governments in this part of Africa simply do not
have. Comparison of the two maps shows that, in most
areas, the extent of actual agricultural use correlates
with soil quality. There are few anomalous areas,
however, such as the prominent high-intensity farming
area in East Central Sudan and along the Nile River to
the north. Farming in both these areas is supported by
extensive irrigation systems. Other anomalous areas
represent farming under poor conditions, which means
farmers get very little back for a lot of work. Why do
it? Because, in many cases, you either farm the poor land
for a little food or die of starvation. More details
about these data can be obtained from the Home page of
the Greater Horn of Africa Project. Land Use - Crops (download
TIFF) This map shows the percentage of land actually
used for agriculture. It shows land used for dry,
rain-fed, and irrigated farming. Thus this map shows
actual land use in spite of problems, such as lack of
rain or alkaline soil, while the Soil Suitability map
shows the potential for farming without technological
aids, such as mechanized irrigation systems or chemical
fertilizers. This is an important distinction, because
the technology that would allow use of more land usually
requires large amounts of money that ordinary people and
even governments in this part of Africa simply do not
have. Comparison of the two maps shows that, in most
areas, the extent of actual agricultural use correlates
with soil quality. There are few anomalous areas,
however, such as the prominent high-intensity farming
area in East Central Sudan and along the Nile River to
the north. Farming in both these areas is supported by
extensive irrigation systems. Other anomalous areas
represent farming under poor conditions, which means
farmers get very little back for a lot of work. Why do
it? Because, in many cases, you either farm the poor land
for a little food or die of starvation. More details
about these data can be obtained from the Home page of
the Greater Horn of Africa Project.
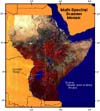 Multi-Spectral Scanner Mosaic (download
TIFF) This map shows a false-color mosaic of
satellite images. In the color scheme used here,
vegetation shows up in tones of red, barren or nearly
barren rock and soils are greenish or grayish, and sand
shows up as yellow or white. Water is colored an
artificial deep blue. The outline of the satellite image
of the Virunga Mountains available in the Local Scale
images can be seen at lower left. Multi-Spectral Scanner Mosaic (download
TIFF) This map shows a false-color mosaic of
satellite images. In the color scheme used here,
vegetation shows up in tones of red, barren or nearly
barren rock and soils are greenish or grayish, and sand
shows up as yellow or white. Water is colored an
artificial deep blue. The outline of the satellite image
of the Virunga Mountains available in the Local Scale
images can be seen at lower left.
 East Africa Base Map (download
TIFF) This map includes political boundaries and
coastlines at the same scale as the other maps in this
set. Use this map to add your own data leaves to the GIS. East Africa Base Map (download
TIFF) This map includes political boundaries and
coastlines at the same scale as the other maps in this
set. Use this map to add your own data leaves to the GIS.
[ Geographic &
Remote Sensing Information ]
[ Continental Scale: East Africa ] [ Regional Scale: Rwanda &
Neighbors ]
[ Local Scale: The
Virguna Mountains ] [ Remote Sensing/GIS
Activities ]
[ Glossary
] [ Related Links
] [ References ] [
PBL Model
]
[
Home
] [ Teacher
Pages ] [
Modules &
Activities ]
|