RASTER IMAGES
Session 2
Kathryn Keranen
As stated in, Remote Sensing
by James B. Campbell,". . . [in] raster data structure
[raster grid]; each image is created as an array of value. . .
Each pixel is treated as a separate unit, which can always be
located within the image by its' row and column coordinates.
Raster data structure offers advantages for manipulation of pixel
values by image processing systems, as it is easy to find and
locate pixels and their values."
MAKING A RASTER IMAGE
- Open simple text.
- Type in data numbers with a space between each number.

- Save the file as a text file in aete. Save as
"test.txt".
- Open NIH Image.
- File import. (Navigate to the folder aete and
find"test.txt".
- Check text and open file.
- Find the little, tiny box in the upper left hand
corner.
- Click on the tiny box. Then from the Options, select
"Scale to fit window". Go back to that tiny box
and click and drag it to enlarge. What you see is the
raster grid for the values entered. By adding color
(Options and select Color Table), you can see that each
value has a designated color. Same values in the raster
grid are the same color.
- Check the rows, columns and data number.
- Analyze -- Surface Plot
- Analyze -- Show Histogram
- Explanation of frequency histogram.
- Scale
- Let 1 pixel = 10 meters.
- Measure 1 pixel. Use the dancing ant line.
- Analyze -- Set Scale
- Units = Meters
- Known distance = 10
- OK
TOPOGRAPHY AND SURFACE PROFILES
In this activity, you create a surface profile by using a
raster grid and elevation values. This surface profile will help
you to analyze the topography of an area.
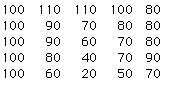
- Open simple text. Enter the following elevation
values, in order, reading across each row. Remember, you
must space once between each value.
- Open the NIH Image software and follow the directions
above.
- Once you have your raster grid for the elevation
values, select from the menu Analyze then select Surface
Plot and OK.
- Using the surface plot, explain how rainfall
would drain off the land in this region.
- Where are the highest elevations located?
- If you could look at an aerial photograph of
this area, what would you expect to see?
- Describe how the "measuring tool"
could be used to analyze surface profiles.
- Where on your surface profile is the steepest
slope? What was the angle of this slope?
OTHER EXAMPLES
- Topography of School
- Vegetation Covers
- Heat Maps
Session 2 -- Part 2
Session 3