

Global Temperatures: Global Mean Temperatures as an Indicator of Global Climate Change
About This Module
Topics: Climate, Greenhouse Gases, CO2 -driven Changes, Temperature Anomalies
Grade Levels: 9-12
Scenario
Global climate change is a change in the long-term weather patterns that characterize the regions of the world. The term "weather" refers to the short-term changes in temperature, wind, and/or precipitation of a region. Weather is influenced by the sun and many other factors. The sun heats Earth's atmosphere and its surface, causing air and water to move around the planet. The result can be as simple as a slight breeze or as complex as the formation of a hurricane.
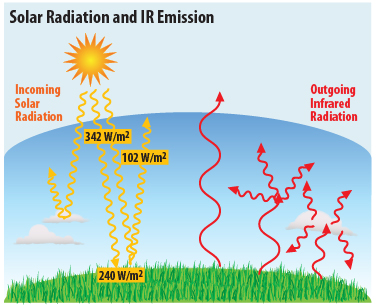 Some of the sun's incoming short wave radiation is reflected back to space by aerosols—very small particles of dust, water vapor, or chemicals in Earth's atmosphere. In addition, some of the sun's energy that enters Earth's atmosphere is reflected into space by the planet's surface. The reflectivity of Earth's surface and clouds is called albedo. Reflection of solar radiation by aerosols, clouds, and the surface all cool the planet.
The greenhouse effect is a planetary warming process. Some of the radiation from the sun is absorbed by Earth's surface. As the surface heats, it emits long wave radiation (in the infrared) toward the atmosphere. There some of this long wave radiation is absorbed by certain gases called greenhouse gases. These include carbon dioxide (CO2), chlorofluorocarbons (CFCs), methane (CH4), nitrous oxide (N2O), tropospheric ozone (O3), and water vapor (H2O). Each molecule of greenhouse gas becomes energized by the long wave radiation. The energized molecules of gas then emit long wave radiation in all directions, some toward the Earth, warming the planet and increasing Earth's temperature. Note that the warming mechanism for the greenhouse effect is not exactly the same as the warming mechanism of greenhouse walls. While greenhouse gases absorb long wave radiation, then emit that energized long wave radiation in all directions, greenhouse walls physically trap heat inside of greenhouses and prevent it from escaping to the atmosphere.
The greenhouse effect is a natural occurrence that maintains Earth's average temperature at approximately 60 degrees Fahrenheit. The greenhouse effect is a necessary phenomenon that keeps all of Earth's heat from escaping to the outer atmosphere. Without the greenhouse effect temperatures on Earth would be much lower than they are now, and the existence of life as we know it on this planet would not be possible. However, increasing greenhouse gases in Earth's atmosphere could increase the greenhouse effect. This could result in an increase in mean global temperatures as well as changes in precipitation patterns.
When weather patterns for an area, influenced by temperature, change in one direction over long periods of time, they can result in a net climate change for that area. The key concept in climate change is time. Natural changes in climate usually occur over such long periods of time that they often are not noticed within several human lifetimes. This gradual nature of change enables plants, animals, and microorganisms to evolve and adapt to the new temperatures and precipitation patterns.
The real threat of climate change lies in how rapidly the change occurs. Scientists are in agreement that global temperatures have increased about 0.8 degrees Celsius since 1900. These temperature changes are depicted in the graph of global land-ocean temperatures shown below from NASA’s GIS Surface Temperature Analysis. The graph (below) shows that increases in mean global temperature have occurred recently at greater rates. Further evidence suggests that future increases in mean global temperature may occur at a rate of 0.2 degrees Celsius (0.4 degrees Fahrenheit) each decade.

Source: NASA-GISS surface temperature analysis: http://climate.nasa.gov/key_indicators#globalTemp
Image description: This graph illustrates the change in global surface temperature relative to 1951-1980 average temperatures. Global surface temperatures in 2012 were the ninth warmest on record. (Source: NASA/GISS) The gray error bars represent the uncertainty on measurements. This research is broadly consistent with similar constructions prepared by the Climatic Research Unit and the National Atmospheric and Oceanic Administration.
The geological record—the physical evidence of the results of processes that have occurred on Earth since it formed—provides evidence of climate changes similar in magnitude to those in the maps above. This means during Earth's history there have been changes in global temperatures similar to these changes. However, the past changes occurred at much slower rates, and thus they were spread out over long periods of time. The slow rate of change allowed most species enough time to adapt to the new climate. The current faster rates of temperature change, on the other hand, might harm ecosystems. Many species of plants, animals, and microorganisms might not have enough time to adapt to the new climate and might become extinct.
Task: Global Mean Temperatures
As a research scientist for the U.S. Panel on Global Climate Change Research, you and your colleagues have been collecting data in the field for months. You have studied research on varying aspects of Earth’s diverse ecosystems, and your colleagues are now gathering to share their experiences and preliminary findings with the rest of the group.
With a major international conference looming, it’s time for all of you to analyze the data and formulate a comprehensive report on global climate change on planet Earth. This conference requires more than a standard report citing data and displaying results in tables and graphs. Analysis of the data will be required to present an accurate picture of the state of the planet’s climate and trends that have been the focus of heated controversy and debate for the last decade. As a scientist, you naturally look at the data from purely objective perspectives.
Given the ongoing controversy surrounding the recorded rise in Earth’s global mean temperatures, your team will have to provide some concrete analysis of temperature data for the report.
Remember: There are quite a few research teams analyzing different global climate change indicators. Your indicator, global mean temperatures, will be an important component to the overall climate change picture.
In order to present accurate, complete, and valid findings, answer the following questions or follow the instructions:
1) Analyze data and identify any trend that occurred in global mean temperatures.
Think “before and after” to help you identify a big picture of Earth's temperature and the changes that may have occurred over decades.
2) What are the impacts of this change? Remember to report the impacts to humans, wildlife, ecosystems, etc.
Changes in environmental temperatures have long-reaching impact and might be slow to develop. This doesn’t mean they are not significant. Look at the long-range effects. The International Panel on Climate Change will need to know impending impacts in order to plan for the future.
3) What appears to be the source(s) of the changes? Can you identify a major cause?
Identifying the cause or source of the changes is important for finding possible ways to remediate the impacts.
4) What strategies do you see that could mitigate or lessen the change? How long would they take to make a difference? What are the pros and cons of the approach?
Sample Rubrics
The developing rubrics page in the Problem Based Learning section provides a content-specific rubric for the Global Temperatures module under the Sample Rubrics heading.
Skill Building Activities
 The following activity can be used to help your students learn how they can use NASA satellite data resources to solve the problem-based learning task presented.
Title: Is Grandpa Right, Were Winters Colder When He Was a Boy?
Estimated Time for Completing Activity: 50 minutes
Learning outcomes for this activity:
Students will:
• Access NOAA and NASA climate data from Internet resources.
• Determine changes in average temperatures, precipitation, and cloud cover over time from data.
• Relate global changes to local changes.
Learning Objectives
Alignment of Learning Objectives and Standards
-Temperature as a Key Indicator
|
Learning Objective |
National Science Content Standard Grades 9-12 |
West Virginia State Science Standard Grades 9-12 |
NASA GCCE |
|
|
Apply research skills to locate relevant data on an environmental issue.
|
3 |
A—Science As Inquiry C—Life Science D—Earth and Space Science
|
CS: 1—Nature of Science CS: 2—Content of Science—Conceptual Biology CS: 3—Application of Science |
|
|
Analyze data to identify trends occurring in global mean temperatures. |
|
A—Science As Inquiry E—Science and Technology |
CS: 1—Nature of Science CS: 2—Content of Science— Conceptual Biology Biology CS: 3—Application of Science |
|
|
Use scientific data to support a position on global mean temperatures as an environmental issue. |
4e 4f |
A—Science As Inquiry E—Science and Technology |
CS: 1—Nature of Science CS: 2—Content of Science—Conceptual Biology CS: 3—Application of Science |
|
|
Relate historical perspectives to global climate change research. |
4e 4f |
E—Science and Technology G—History and the Nature of Science |
CS: 2—Content of Science—Earth Science |
|
|
Explain the impacts of changes in environmental temperatures and understand these changes may be long-reaching and slow to develop. |
|
C—Life Science F—Science in Personal and Social Perspectives |
CS: 2—Content of Science—Biology Environmental Science Conceptual Science Earth Science |
|
|
Describe underlying environmental mechanisms that drive global mean temperature trends. |
1 2c 3b 4f |
C—Life Science D—Earth and Space Science |
CS: 2—Content of Science—Physical Science Environmental Science Earth Science |
|
|
Identify anthropogenic sources of increased global mean temperatures. |
1 4f |
C—Life Science
|
CS: 2—Content of Science— Environmental Science |
|
|
Explain possible human consequences to predicted global climate change. |
|
C—Life Science F—Science in Personal and Social Perspectives |
CS: 2—Content of Science— Environmental Science Conceptual Science |
|
|
List key atmospheric greenhouse gases and explain their significance to the global temperature issue. |
1 2c |
D—Earth and Space Science |
CS: 2—Content of Science— Environmental Science |
|
|
Explain the carbon cycle, carbon sources and sinks within the cycle, and its significance to global temperatures. |
|
D—Earth and Space Science |
CS: 2—Content of Science— Environmental Science |
|
|
Students investigate and understand that energy transfer between the sun and the Earth and its atmosphere drives weather and climate on Earth. Key concepts include weather phenomena and the factors that affect climate including radiation and convection |
|
|
|
Featured Data
Go to Global Temperatures Featured Data ![]()

Access these and other data graphs in the Feature Data section for Global Temperatures
Global Temperature Trends
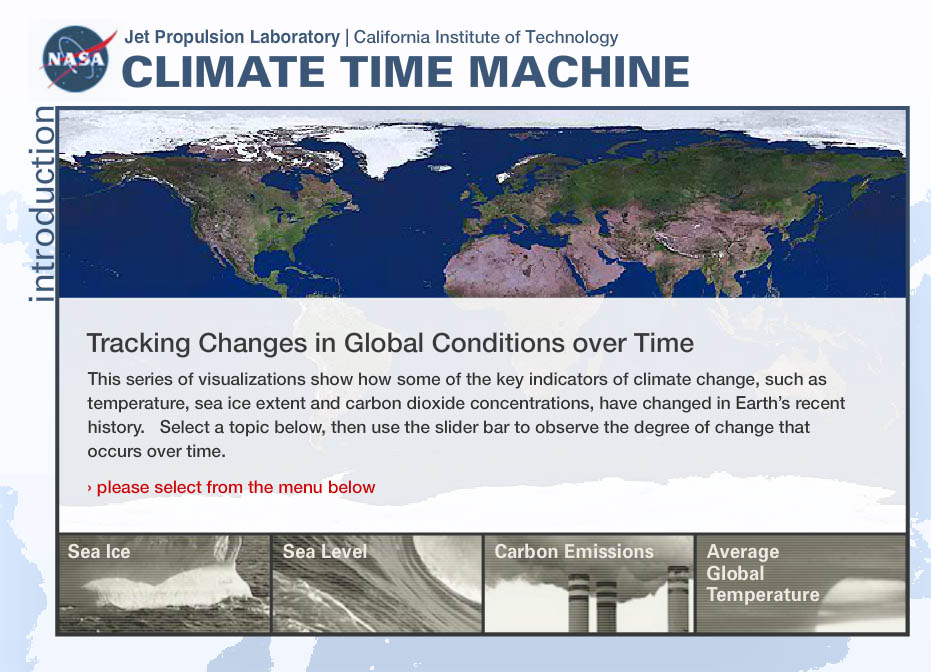
Climate Time Machine

The Climate Time Machine is a color-coded interactive map that shows a progression of changing global surface temperatures from 1885 to 2007. Dark blue indicates areas cooler than average. Dark red indicates areas warmer than average.
(Credit: NASA/Goddard Scientific Visualization Studio.)
What does the Climate Time Machine tell you about your state's temperatures during this 122-year period?
Global Average Temperature Anomalies
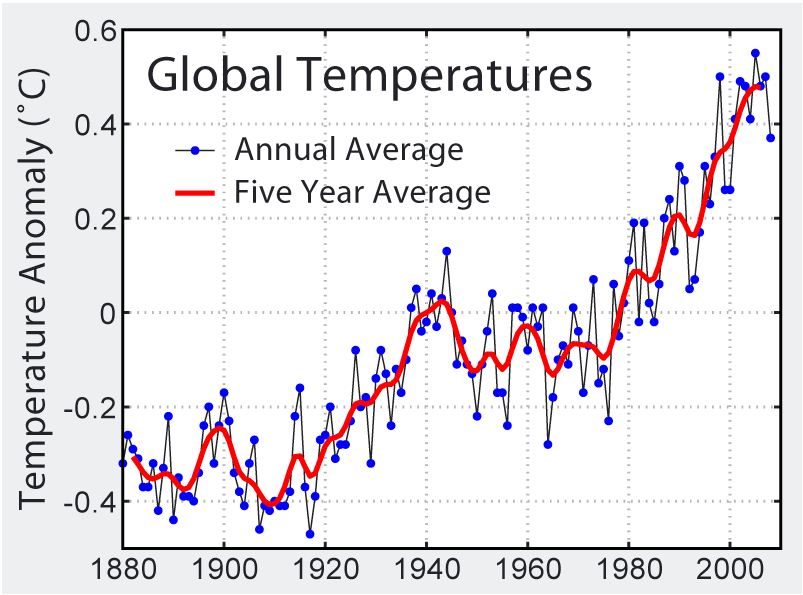
This graph shows the record of global average temperature anomalies compiled by NASA’s Goddard Institute for Space Studies. The “zero” on this graph corresponds to the mean temperature anomaly from 1961-1990, as directed by the Intergovernmental Panel on Climate Change (IPCC).
Temperature Anomalies 1880-2010
Temperature anomalies from meteorological stations, showing both annual means and a five-year mean.
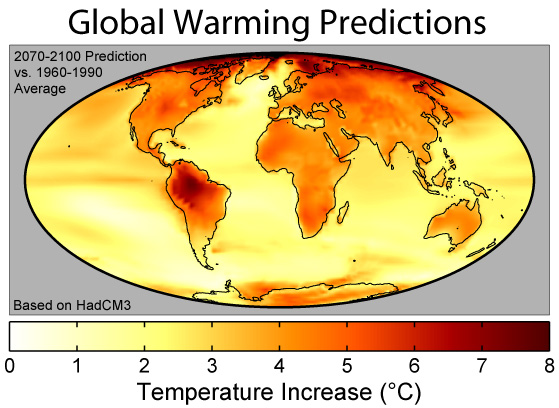
Datasets from the Hadley Centre HadCM3 Climate Model
Predicted temperature change because of global warming as issued by the Hadley Centre climate model. The colors show predicted average temperature changes for 2070-2100. Notice the distinct warming difference between land and water. The strong warming around the Arctic Ocean is related to melting sea ice, and the strong warming in South America is related to El Nino cycles. (Models differ according to variables considered.)
Intergovernmental Panel on Climate Change (IPCC) Table of Risks and Impacts of Global Warming
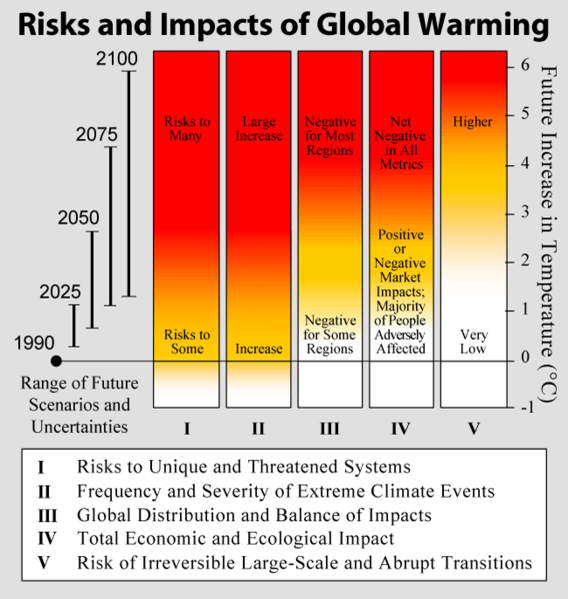
An assessment of the relative impact and risks associated with global warming. Five categories are assessed. The bars are color-coded to show level of impact or concern for each factor as a function of temperature increase.
Data source: Third Assessment Report of the Intergovernmental Panel on Climate Change (IPCC).
Resources
NASA Eyes on Earth—Global Climate Change
http://climate.nasa.gov/
This comprehensive site provides valuable information on climate change indicators, including data, graphs, scientific investigations, and animations for a range of grade levels.
NASA Earth Observatory—Global Warming
http://earthobservatory.nasa.gov/Features/GlobalWarming/
Basics about global climate change and links to additional resources and information.
Global Warming—Frequently Asked Questions
http://lwf.ncdc.noaa.gov/oa/climate/globalwarming.html
http://www.epa.gov/climatechange/
This comprehensive site provides in-depth information on a wide variety of climate change topics. A great research tool.
Climate Change Indicator Report—U.S. EPA
http://www.epa.gov/climatechange/indicators.html
Climate change indicator study full report and slideshow. Individual chapters are also available for print and include topics such as greenhouse gases, weather and climate, oceans, snow and ice, and summary of key findings.
High School Environmental Center
http://www.epa.gov/highschool/
This EPA site covers topics such as air, water, conservation, ecosystems, waste and recycling, and health and safety. The “Your Neighborhood” section provides links to information about how you can apply environmental issues to your local community.
Greenhouse Gas Emissions
http://www.epa.gov/climatechange/emissions/index.html
Information about various greenhouse gases, emissions and sinks, and emission trends and projections.
NOAA News Online—Global Warming
http://www.noaanews.noaa.gov/stories/s379.htm
News story about NOAA reporting record-breaking temperatures seen as possible evidence of faster rate of global warming.
