Global Temperatures
Temperature Trends and Data
Recent evidence from numerous scientific reports draw similar conclusions: Earth is warming. Hundreds of scientists from many countries contributed to studies that confirm that the first decade of the 21st century was the warmest on record and that Earth has been growing warmer for the last 50 years.
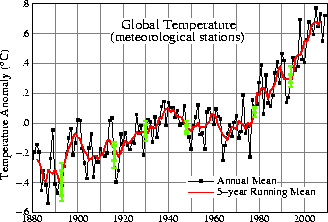
Global Mean Surface Temperature Changes—1880-present
 Red line—5-year running averages
Black line—annual (yearly) averages
(Normal seasonal fluctuations cause the variability seen on the graph.)
Note: 5-year running averages are calculated by averaging temperatures over 60 months prior to the date for which they are given.
|
Hansen et al. (2001) |
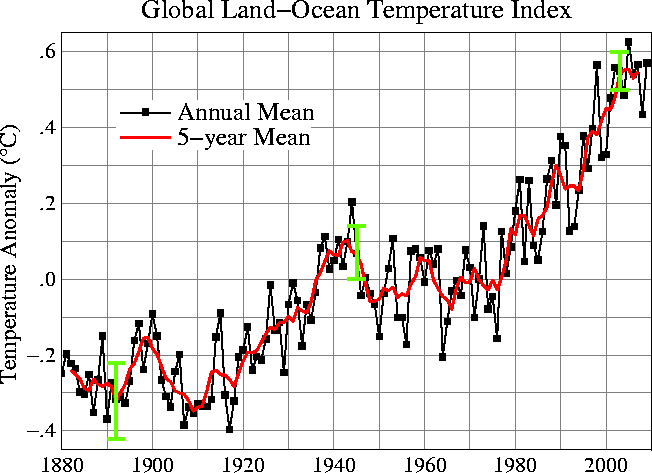
Global Mean Land-Ocean Surface Temperature Changes—1880-present
 Red line—5-year running averages
Black line—annual (yearly) averages
(Normal seasonal fluctuations cause the variability seen on the graph.)
Note: 5-year running averages are calculated by averaging temperatures over 60 months prior to the date for which they are given.
|
Hansen et al. (2001) |
“For the first time, an analysis brings together multiple observational records from the top of the atmosphere to the depths of the ocean,” said Jane Lubchenco, Ph.D., undersecretary of commerce for oceans and atmosphere and NOAA administrator. “The records come from many institutions worldwide. They use data collected from diverse sources, including satellites, weather balloons, weather stations, ships, buoys, and field surveys. These independently produced lines of evidence all point to the same conclusion: Our planet is warming.”
There is naturally some short-term variability in Earth’s temperatures. Phenomena such as El Nino and La Nina, for example, contribute to temperatures that are either warmer or cooler in some areas, depending on the strength of the El Nino or La Nina for that year. Analyzing climate change, however, demands looking at longer term data records. When scientists look at long-term records and analyze independent studies from around the world, they see clear signs of a warming world. For the last 30 years each decade has been warmer than the one before. The 1980s was the hottest decade on record at that time; in the 1990s every year was warmer than the year a decade ago (in the 1980s), and the 2000s have been warmer still.
The predicted average increases in global temperatures seem small to some people when they read about increases of 1 degree. However, even 1-degree temperature change can affect plants and animals in an ecosystem which will, in turn, have impacts on the ecosystem as a whole. Also, a small increase can cause major changes in physical environments. Glaciers and sea ice are melting, more severe weather events are occurring, and shifts in weather are changing boundaries of agriculture areas and river flows. In addition, it is important to remember that the predicted increases are averages. A 1-degree increase in one area may mean a 10-degree increase is occurring somewhere else.
Reference: http://www.noaanews.noaa.gov/stories2010/20100728_stateoftheclimate.html


