
![]()
![]()
![]()
Water
Quality Assessment: Physical: Forest Canopy
Canopy cover is
the percentage of a sample area shaded by vegetation. Canopy cover plays
an important role in stream water quality. For example, headwater
streams are generally located deep within forests where canopy cover
is nearly 100%. The canopy provides nutrient inputs through litter fall.
It also provides shade that keeps the stream water cool.
A large canopy cover may indicate a large amount of vegetation along the
stream. This results in increased stabilization of the stream bank by
roots, and therefore decreased erosion.
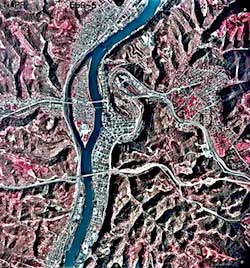 Remote
sensing is the tool most often used to examine canopy cover over large
areas. Remote sensing ranges from satellite images that differentiate
among soil, water and vegetation by the type of light reflected, to pictures
taken from airplanes. High-level aerial photographs like the one below
can show distinct landforms such as forests, pastures, and tilled lands,
in addition to highways and waterways. Photo:
Aerial photograph of the upper Wheeling Creek watershed. Photo courtesy
of Dr. Ben Stout.
Remote
sensing is the tool most often used to examine canopy cover over large
areas. Remote sensing ranges from satellite images that differentiate
among soil, water and vegetation by the type of light reflected, to pictures
taken from airplanes. High-level aerial photographs like the one below
can show distinct landforms such as forests, pastures, and tilled lands,
in addition to highways and waterways. Photo:
Aerial photograph of the upper Wheeling Creek watershed. Photo courtesy
of Dr. Ben Stout.
Canopy cover can also be estimated more economically by standing in the center of the sample area and looking at the sky directly overhead. Scientists estimate the percentage of their field of vision that appears to be covered by vegetation. This percentage is the canopy cover. A similar method entails taking a picture from this position and measuring the percentage of the picture covered with vegetation using image analysis software.
The percentage of a stream covered by canopy decreases naturally with increasing stream order. This is a function of stream width. However, canopy cover can also be diminished by human activities such as logging, farming and construction. For this reason, measurements of canopy cover can be useful in detecting certain polluters--either present or past.
Overview ..|.. Biological Assessment ..|.. Chemical Assessment ..|.. Physical Assessment.
Elevation
and Catchment Area / Stream Order /
Forest Canopy / Width, Depth, and Velocity
/ Rock Size / Turbidity
/ Total Solids / Temperature Home
..|..
Teacher Pages
..|..
Modules
& Activities
Glossary .|.
Related Links
.|..
References
..|..
PBL Model
.|
HTML code by Chris Kreger
Maintained by ETE Team
Last updated November 10, 2004
Some images © 2004 www.clipart.com
Privacy Statement and Copyright © 1997-2004 by Wheeling Jesuit University/NASA-supported Classroom of the Future. All rights reserved.
Center for Educational Technologies, Circuit Board/Apple graphic logo, and COTF Classroom of the Future logo are registered trademarks of Wheeling Jesuit University.