
![]()
![]()
![]()
Water
Quality Assessment: Physical: Width, Depth, and Velocity
Stream width and
depth affect many other characteristics of a stream. For example, a stream
flowing through a wide, shallow channel will receive more sunlight throughout
its water column. Increased sunlight will cause the shallow water to become
warmer throughout. Also, streams that have
uniform depths across their entire widths tend to flow with greater velocity
or speed because there is nothing to slow them.
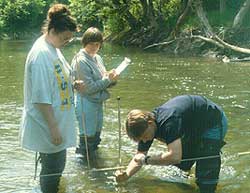 Velocity
can be measured with a flow meter at the same time width and depth are
measured (see photo). This is accomplished by stretching a meter tape
across the entire width of the stream and noting the distance. At regular
intervals (usually 0.5 m) across the width of the stream, depth should
be measured. At these points, the flow of the stream can be measured by
following the directions that accompany the flow meter.
Photo: Students measuring stream width
with a meter tape, depth with a meter stick, and flow with a flow meter
along Wheeling Creek. Photo courtesy of Ben Stout.
Velocity
can be measured with a flow meter at the same time width and depth are
measured (see photo). This is accomplished by stretching a meter tape
across the entire width of the stream and noting the distance. At regular
intervals (usually 0.5 m) across the width of the stream, depth should
be measured. At these points, the flow of the stream can be measured by
following the directions that accompany the flow meter.
Photo: Students measuring stream width
with a meter tape, depth with a meter stick, and flow with a flow meter
along Wheeling Creek. Photo courtesy of Ben Stout.
If a flow meter is not available, the velocity of a stream can be measured by determining the amount of time for an object such as a small film canister or a fishing bobber to float 1 m down the middle of the stream. This procedure should be repeated three times. Results from any trials in which the object gets caught on the bank, in debris, or in a whirl pool should be discarded. Velocity an then be calculated as the average of the three trials.
Uniform depths and high velocities may indicate dredging.
Overview ..|.. Biological Assessment ..|.. Chemical Assessment ..|.. Physical Assessment.
Elevation
and Catchment Area / Stream Order /
Forest Canopy / Width, Depth, and Velocity
/ Rock Size / Turbidity
/ Total Solids / Temperature Home
..|..
Teacher Pages
..|..
Modules
& Activities
Glossary .|.
Related Links
.|..
References
..|..
PBL Model
.|
HTML code by Chris Kreger
Maintained by ETE Team
Last updated November 10, 2004
Some images © 2004 www.clipart.com
Privacy Statement and Copyright © 1997-2004 by Wheeling Jesuit University/NASA-supported Classroom of the Future. All rights reserved.
Center for Educational Technologies, Circuit Board/Apple graphic logo, and COTF Classroom of the Future logo are registered trademarks of Wheeling Jesuit University.