    |
Activity 1: Seeing Environmental Change This set of activities will give your group a visual and qualitative understanding of the changes around Rio Branco.
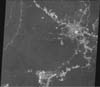
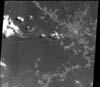
First, get an overview: Click on the above images of the Rio Branco area to get a satellite's eye view of the area and the changes between 1986 and 1992. To examine these in greater detail download to your hard drive Brazil 1-2 (the 1986 image) and Brazil 2-2 (the 1992 image) from the list in the landsat image set and compare them using NIH Image. You can just look at the images separately, but comparisons are more easily seen by a) stacking and animating the two images, or by b) ratioing the images using image arithmetic (directions to carry out these procedures are given in image processing procedures). Obviously, there are significant differences between the two images. In order to use these images in your project, you need to consider two questions: (1) what are you looking at in the satellite images, and (2) what has changed between 1986 and 1992? So, what are you looking at? The images show both natural features (the rainforest, rivers, clouds, etc.) and man-made features (roads, towns, small farms, large ranches, etc.). Can you tell which is which? Satellites view objects on the surface of the earth from overhead, a new perspective for many people, so it may take a little practice to recognize features in satellite images. Here are two approaches you can use to help identify what you are looking at: 1. Enlarged Sections: One important factor in your ability to identify objects in the world around you is the object's shape or appearance. To identify the shape of an object from an image, a certain amount of detail of the object must be visible. If an object in a picture appears as only a single bright spot, then it is hard to say what the object is. The amount of detail of an object visible in a satellite image depends on the size of the object and the resolution of the image. For example, in the images given in the landsat image set, which show the whole area around Rio Branco (like Brazil 1-2), the width of the area shown in the (slightly slanted) image is about 185 kilometers on the ground. The width of the image is about 614 pixels. So the size of the patch of ground shown by each pixel is about 185 km/614 pixels, or about 300 meters across. ("Resolution" and "pixels" are discussed in the "Mars Landing" Image Processing Activity). This means any features smaller than a whole high school campus such as a building or football stadium would not be discernible. The resolution in the original full image is much better, about 30 meters per pixel, which would show large buildings as one or two dots. It would be ideal to simply give you the whole original image so that you could see anything you wanted in detail, but the whole image is over 40 Megabytes, much larger than most desktop computers can handle. Instead, we have supplied you with enlargements of several small sections of the main image that show representative features at nearly full resolution.
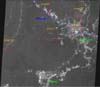
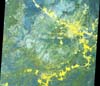
Areas shown in the enlarged sections are identified by outline and file name in the locator map above and correspond to file names on the list in the landsat image set . These enlargements should help you identify features seen at low resolution in images like Brazil 1-2 and 2-2. The technical procedure for this activity is straightforward. Simply open different files and look at them. You might also try stretching the images to bring out particular details. The main challenge is to carefully examine different types of features in the images and to define characteristics that will allow you to identify them with confidence to your classmates. You might want to make a list of the different features you can identify and their visual characteristics. Color Composites: Another important factor in your ability to identify objects in the world around you is by their color: Plants are usually green, bare ground is different shades of brown, and fresh asphalt streets are black. The individual images supplied here are all single-color or brightness images called bands, but they can be combined to provide different kinds of color views of the area. The procedure for making color composites is given in image processing procedures. Using NIH Image, open Brazil 1-3, 1-2, and 1-1 (in that order) from the landsat image set and create your own true-color image. This will show the rainforest as dark green, fresh fields as light green and brown, cities as bright tan, and clouds as brilliant blue-white. Combining this color information with the shape information you found in the previous activity will help with your identifications. Other types of color images, called false color composites, can be made by combining any three bands other than blue (band 1), green (band 2), or red (band 3). A commonly used combination in Landsat imagery, which emphasizes plants, combines either band 4 or 5, in which plants are very bright, with bands 3 and 2. To make this composite, open from the Brazilian landsat link either Brazil 1-4 or 1-5 and then 1-3, and finally 1-2. Now the rainforest shows in various shades of bright red, fresh vegetation in light pink, and bare ground and human habitations in various shades of green and blue (depending on the stretch). The rainforest still looks pretty uniform using this combination, yet there is considerable variation in the rainforest vegetation. One combination that brings out differences in the rainforest itself is (in order) Brazil 1-7, 1-5, and 1-4. By carefully stretching the individual bands (see the "Mars Landing" Activity) until the agricultural and inhabited areas are white or "burned out," and then forming the color composite, an image showing large differences in the rainforest vegetation is formed. It is not easy to get good color contrast. For comparison, click on the image "Rainforest 4-5-7" below to see one version of the rainforest made using ER Mapper, a professional level, interactive image processing program.
Now, what has changed? Six years passed between taking Brazil 1-2 in 1986 and Brazil 2-2 in 1992. Now that you have an idea what the different features in the two images are, you can begin to look in detail at what features changed. Following the directions in image processing procedures, stack and animate or ratio Brazil 1-2 and 2-2. Note what types of features changed and where most of the changes occurred. Several of the enlarged sections are also available for both 1986 and 1992. These may also be stacked and animated to see changes in detail. You might look for changes in the cities, farms, and ground cover in developed areas. You also might note where the changes are most rapid, and how changes are related to roads or rivers. Once you see where and how fast the changes have occurred, you can begin to make reasonable predictions about where future changes are most likely to be.
[ Amazon Rain Forest: View from Space ] [ Seeing Environmental Change ] [ Home ] [ Teacher Pages ] [ Modules & Activities ] |
![]()
Page created by Chris Kreger
Maintained by ETE Team
Last updated November 10, 2004
Some images © 2004 www.clipart.com
Privacy Statement and Copyright © 1997-2004 by Wheeling Jesuit University/NASA-supported Classroom of the Future. All rights reserved.
Center for Educational Technologies, Circuit Board/Apple graphic logo, and COTF Classroom of the Future logo are registered trademarks of Wheeling Jesuit University.