 Water
Quality Assessment: Biological: Macroinvertebrates
To assess the biological
attributes of water quality, scientists generally examine benthic
macroinvertebrates. These organisms
are abundant, easier to capture than fish, and easier to identify than
algae or protozoa. Benthic macroinvertebrates include crustaceans, mollusks,
worms, and many species of insect larva such as mayflies, stoneflies,
caddisflies, and beetles. Samples of macroinvertebrates can be collected
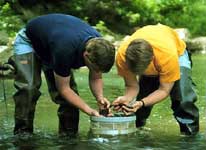
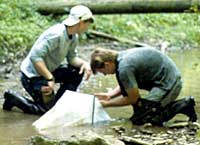
over areas of uniform size using a Hess sampler (below) in large (fifth-
and sixth-order) streams. A Surber sampler (below) is usually
used in smaller streams. Generally, three samples are collected from one
riffle per study site.
Photos
from top to bottom:
1. A decopod crustacean or "crawdad." Photo
courtesy of Dr. Ken Rastall.
2. Aquatic beetle larvae.
Photo courtesy of James Hodges, Jr.
3. Mayflies grazing on algae. Photo
courtesy of Larry Willis.
4. A predacious stonefly. Photo
courtesy of James Hodges, Jr.
5. Case-building caddisflies.
Photo courtesy of James Hodges, Jr.
6. A muscle, mollusk, or bi-valve--all clammed up. Photo
courtesy of Dr. Ken Rastall.
Macroinvertebrates from each sample are identified and counted. The density of organisms per square meter of stream bottom at each site is estimated from the average of the samples collected there. A calculation of species diversity such as the Shannon Index of Species Diversity can be performed on this data. The Shannon Index of Species Diversity is often performed on macroinvertebrate order data rather than species data.
The abundance of macroinvertebrates
belonging to the orders Ephemeroptera, Plecoptera, and Trichoptera
should be noted. These three orders constitute the EPT
Index of a stream. Since these orders of macroinvertebrates are highly
sensitive to pollution, they are often used as water quality indicators.
Their presence indicates a high quality of water, while their absence
suggests water may be polluted. The EPT Index is calculated as the sum
of the number of Ephemeroptera, Plecoptera, and Trichoptera
divided by the total number of midges. Midges (Diptera: Chironomidae)
are a species of fly that are present in large numbers in nearly all streams.
 |
 |
| Students using a Hess sampler to collect benthic sample in a large stream in the Wheeling Creek watershed. Photo courtesy of Dr. Ben Stout. | Students using a Surber sampler to collect benthic sample in a small stream in the Wheeling Creek watershed. Photo courtesy of Dr. Ben Stout. |
Overview
..|.. Biological
Assessment
..|.. Chemical
Assessment ..|..
Physical Assessment. Home
..|..
Teacher Pages
..|..
Modules
& Activities
Glossary
.|. Related Links
.|..
References
..|..
PBL Model
.|
Macroinvertebrates
HTML code by Chris Kreger
Maintained by ETE Team
Last updated November 10, 2004
Some images © 2004 www.clipart.com
Privacy Statement and Copyright © 1997-2004 by Wheeling Jesuit University/NASA-supported Classroom of the Future. All rights reserved.
Center for Educational Technologies, Circuit Board/Apple graphic logo, and COTF Classroom of the Future logo are registered trademarks of Wheeling Jesuit University.
