![]()
![]()
![]() Week
Ten: Global Ice and Water Activities
Week
Ten: Global Ice and Water Activities
 Can
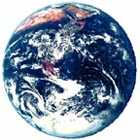
you imagine being high above Earth and floating free like an astronaut
aboard the Space Shuttle orbiting the planet? Looking out from your craft,
you view this spectacular blue and white sphere called Earth that serves
as home for you and all other life as people know it. It is the only body
in the solar system that appears to support life. Although Earth is largely
rock, most of what you see of Earth's surface is covered by a relatively
thin layer of water (some of it frozen).
Can
you imagine being high above Earth and floating free like an astronaut
aboard the Space Shuttle orbiting the planet? Looking out from your craft,
you view this spectacular blue and white sphere called Earth that serves
as home for you and all other life as people know it. It is the only body
in the solar system that appears to support life. Although Earth is largely
rock, most of what you see of Earth's surface is covered by a relatively
thin layer of water (some of it frozen).
Water is an important natural resource and is an extremely common substance that covers three-fourths of Earth's surface. It accounts for 60-70% of the weight of the living world. It is also the physical environment in which many plants and animals live. Water is something most people take for granted, but it is essential for life. A person will die much faster from a lack of water than from a lack of food. Some resources are limited and can be used up, like coal. Others, like water, are unlimited and are not "likely" to be used up.
All of this water may seem to be an endless supply; however, 97% of all Earth's water is the salt water contained in the oceans. Of the remaining 3% of water, two-thirds is contained in glaciers and the polar ice caps. The remaining percentage of all of Earth's water--in ground and surface water combined--that is available for human consumption is less than 1% of all the water on the planet. As the world population and pollution increase, the fresh water quality lowers. Additionally, as the world population increases, an increase in the demand for fresh water reduces the 1% that is available for human consumption.
| Breakdown of Earth's Fresh Water: | |
| Ice | 77.197% |
| Ground Water | 22.260% |
| Soil Moisture | 0.180% |
| Lakes | 0.323% |
| Rivers & Streams | 0.004% |
| Atmosphere | 0.036% |
|
Total |
100.00% |
Completion of any or all of the following three activities can provide learners with insights into the relationships between global ice and fresh water and the relationship between global ice and sea level.
I. The Proportion of Water on Earth That Is Fresh
Teacher Notes:
Provide each student group with two 1000 ml beakers, about 10 grams of salt, and a small paper cup.Direct the students to:
- Fill one of the 1000 ml beakers as near to the top as possible. This filled beaker represents all of the water in the world.
- Pour 97% of the water from the filled beaker into the second beaker along with about 7 or 8 grams of salt. The second beaker represents 97% of the world's water that is salty. [NOTE: The vast majority of the planet's water is salty and unsuitable for most domestic, agricultural, and industrial uses.]
- Pour two-thirds of the water remaining in the first beaker into a small paper cup and place it in a freezer. [NOTE: This cup represents two-thirds of all the fresh water on Earth frozen away in glaciers and ice caps. The several drops (1%) that remain at the bottom of the first beaker represent the world's fresh water supply that keeps living things alive.]
II. Pie Charts
Teacher Notes:
Provide each group of students with a large piece of poster paper and have them make three circles of decreasing sizes (large, small, and smallest).Direct students to use the information found on the chart below to:
- In the largest circle (pie), graph and color in the relative percentages of saltwater and freshwater on Earth.
- In the next largest circle (pie), graph and color in the percentages of sources of freshwater on Earth (i.e., rivers, lakes, ice, ground).
- In the smallest circle (pie), graph and color in the percentages of global ice by location (i.e., Antarctica, Greenland, and ice caps.
Sea Level Increase Amounts:
Scientists estimate that if all of Earth's global ice melted and went into the oceans and seas, sea levels would increase by the following:
Antarctica 73.4 meters Greenland 6.5 meters Icecaps 0.6 meters Total
80.5m
III. What Would Happen to the
Coastlines?
What would happen to the coastline of the United States if all of Earth's
global ice melted and went into the oceans and seas?
Teacher Options
1. Direct the students to:
- Get a map of the United States
- Get a World Atlas containing the elevation of cities around the United States.
- Use the estimates of sea level increase from the chart below to draw the new coastline of the United States.
- Discuss within their groups the impact of this event on the plant and animal life, the atmosphere, and Earth's surface and crust.
Sea Level Increase Amounts:
Scientists estimate that if all of Earth's global ice melted and went into the oceans and seas, sea levels would increase by the following:
Antarctica 73.4 meters Greenland 6.5 meters Icecaps 0.6 meters Total
80.5m
- 2. Direct the students to:
- Get a map of the United States
- Use the following telnet address: martini.eecs.imich.edu 3000 to look up the elevation of major cities around the United States.
- Use the estimates of sea level increase to draw the new coastline of the United States.
- Discuss within their groups the impact of this event on the plant and animal life, the atmosphere, and the earth's surface and crust.
- 3. Direct the students to:
- Get a map of the United States.
- Use the U.S. Geological Survey - National Mapping Information Geographic Names Information System - Online Data Base Query Form to gather data regarding the elevation of major cities around the United States.
- Combine the estimates of sea level increase from the chart above with elevation data of cities searched to draw the new coastline of the United States.
- Discuss within their groups the impact of this event on the plant and animal life, the atmosphere, and the earth's surface and crust.
- 4. Using the sea level increase information above, direct the students to:
- Get a map of the United States.
- Use the USGS Elevation Color Database to draw the new coastline of the United States. [Note: Overlaid on the elevation map are data from the USGS DLG (Digital Line Graphics) database. The database offers locations of states, counties, roads, railroads, parks, forests, rivers and lakes.]
- Discuss within their groups the impact of this event on the plant and animal life, the atmosphere, and the earth's surface and crust.
![]()
Week
by Week ...Week
One ...Week
Two ...Week
Three ...
Week Four ...Week
Five ...Week
Six ...Week
Seven ...Week
Eight ...
Week
Nine ...Week
Ten ...Week
Eleven ...Week
Twelve ...
Week
Thirteen ...Week
Fourteen ...Week
Fifteen ...Week
Sixteen ...
Home ...Intro ...Guide ...Classroom
...
![]()


Maintained by ESSC Team
Last Updated July 26, 2000
Privacy Statement and Copyright© 1997-2000 by Wheeling Jesuit University/NASA Classroom of the Future™. All rights reserved.