
 |
Forest Management from Space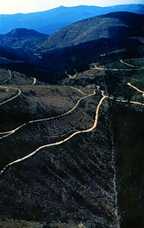 The use and management of land
initially covered by forest depends on the needs and ecological policy of the persons or
organizations that have legal jurisdiction over the land, either through private ownership
or government control. A farmer or developer would clear the forest for crops or homes and
schools. A forest products company would clear-cut the forest and either leave the land
denuded or replant trees for future harvest, depending on company policy or government
requirements. In national forests, a multi-use policy applies. The forest may be left
untouched, used for recreation, cut for forest products, or opened to cattle grazing. In
national parks and national forest wilderness areas, the forest is left undisturbed except
for light recreation. Image: Courtesy of Lighthawk. Image is not to be downloaded or copied without
permission. The use and management of land
initially covered by forest depends on the needs and ecological policy of the persons or
organizations that have legal jurisdiction over the land, either through private ownership
or government control. A farmer or developer would clear the forest for crops or homes and
schools. A forest products company would clear-cut the forest and either leave the land
denuded or replant trees for future harvest, depending on company policy or government
requirements. In national forests, a multi-use policy applies. The forest may be left
untouched, used for recreation, cut for forest products, or opened to cattle grazing. In
national parks and national forest wilderness areas, the forest is left undisturbed except
for light recreation. Image: Courtesy of Lighthawk. Image is not to be downloaded or copied without
permission.Some of the results of different policies of forest management can be seen in satellite images. Originally, the land in the Mount Rainier area satellite image you classified in the Virtual Ground Truthing activity was almost completely covered by old-growth forests. Now old-growth forests cover only a fraction of the area; the rest have been cut down for homes, factories, farms, and lumber. As you saw in the Rainier area map, the land around Mount Rainier is divided into many different jurisdictions: private lands, military reservations, Indian reservations, national forests, and a national park (Mount Rainier). Your objectives in this activity are first to see and then to measure the effect of forest management policy on preservation of the old-growth forest within different jurisdictions of the Rainier area. The first part, seeing, is easy. Download and save this TIFF version of the Rainier area map, which shows only jurisdictional boundaries. Using NIH Image, Open this map and one of the satellite images you downloaded in the Virtual Ground Truthing activity. R752 is probably the best of the three satellite images to use because of its high color contrast. Overlay the map onto the image (the Replace paste option is a good choice for this operation). Save your composite map under a new name. Look at the composite and see where the old-growth forests are located relative to jurisdictional lines. Where are the remaining old-growth forests? Notice that some legal boundaries actually show up as forest boundaries, indicating that in those places logging was done right up to the edge of where it was legal. Now look at jurisdictional differences quantitatively by measuring the percent of the area of a particular jurisdiction that is still covered by old-growth forest. Open both the jurisdiction map and your land-classification map from the Virtual Ground Truthing activity in NIH Image. Make a composite map by overlaying the jurisdiction map onto the land classification map. The Replace paste option is also a good choice for this operation. Save your composite map under a new name. Set up NIH Image to make the specific measurements you want. Set the scale of the composite map using the scale bar. (If you have forgotten how to Set Scale, visit beautiful Honolulu and refresh your memory!) Select Analyze/Options and select Area; deselect all other options. Now you are ready to make your area measurements. First, measure the area of the entire map and all of the old-growth forest on the map. Double-click on the Rectangular Selection tool to select the entire map. Select Analyze/Measure. Now select Options/Density Slice. Use the LUT tool to shrink the red selection bar to a single DN value. Drag the selection bar to the DN value for the old-growth forest. All of the old-growth forest should change to red. Select Analyze/Measure again, and then Analyze/Show Results. The first line will show the total area of the map, and the second line will show the total area of the old-growth forest. Click-and-hold on Options. Note the small check mark by Density Slice, indicating that it is active. Turn off the Density Slice option by reselecting Density Slice. Next time you Click-and-hold on Options, the check mark will be gone. Now measure the total area and area of old-growth forest in each jurisdiction using the following procedure:
Print a copy of the jurisdiction map and label each area as you measure it. If you make a mistake, delete it by selecting Analyze/Delete Measurement and filling out the appropriate cells in the dialog box that appears. When you are finished, select Analyze/Show Results, and a list of your measurements will appear in the order you took them. Print a copy of your measurements by selecting File/Print Results. Now find the total area and old-growth forest area for each jurisdictional type by adding up the area for each individual section. Find the total area and area of old-growth forest on private lands by subtracting the totals for each jurisdictional type from the map totals. Finally, compute the percent area of old-growth forest in each jurisdictional type, and compare each type to see how management has affected preservation. You might also use your results to estimate how long it might take to cut down the old-growth forest remaining on national forest land. [ Viewing Forests from Space ] [ Virtual Ground Truthing ] [ Home ] [ Teacher Pages ] [ Modules & Activities ] |
![]()
HTML code by Chris Kreger
Maintained by ETE Team
Last updated November 10, 2004
Some images © 2004 www.clipart.com
Privacy Statement and Copyright © 1997-2004 by Wheeling Jesuit University/NASA-supported Classroom of the Future. All rights reserved.
Center for Educational Technologies, Circuit Board/Apple graphic logo, and COTF Classroom of the Future logo are registered trademarks of Wheeling Jesuit University.