Skip Navigation
Button that takes you to the teacher pages. Button that takes you to the modules and activities page. Button that takes you to the main Exploring the Environment page. Image that says Exploring the Environment.

Image that says Teacher Pages.Image of an adult woman hugging a small girl.
Button that takes you to the Introduction page.
Button that takes you to the Entry-Level Modules page.
Button that takes you to the Module Notes page.
Button that takes you to the Problem-Based Learning page.
Button that takes you to the Planning, Facilitation, Assessing page.
Button that takes you to the Teacher-to-Teacher page.
Button that takes you to the Software page.
Button that takes you to the Other Useful Web Sites page.

Creating a Working Problem Statement
To help students create a Working Problem Statement (WPS), you may want to pose some introductory questions such as the following:

Are animals and plants really endangered?

What role do rainforests play in climate stabilization?

Has human intervention altered the watersheds of the Amazon?

Realities of the survival of the Amazon Rainforest?

How has worldwide deforestation affected the global community?

What has been the impact of the debate on indigenous peoples?

What can poor countries that are rich in natural resources do to create jobs?


Image that says Module Notes: Tropical Poison.

What is the focus of this module? The purpose of "Tropical Poison" is to have students address questions of habitat destruction in the Amazon Rainforest and think about biodiversity worldwide.

What will students gain from this module? Students should develop critical-thinking and problem-solving skills appropriate for complex situations. They should come to realize that environmental issues are multi-faceted and that solutions most often involve compromise.

What is the compelling problem that students will face in this module? Students must decide, "Is there a problem?" Students will examine opposing views on the Amazon Rainforest and will take a position on land-use and species conservation in one of the last areas of biodiversity on earth.

What issues will students encounter as they work through this module? Students will encounter a variety of issues related to decision-making and the rainforest, all of which may be explored with remote sensing technology:

  • species extinction
  • global warming
  • deforestation
  • water quality
  • displacement/extinction of indigenous peoples
  • sustained environments in a global economy

What is the role of remote sensing in this module? The Remote Sensing Activities in this module will demonstrate how this technology can increase our ability to make informed decisions about habitat and biodiversity preservation.

Rainforest Remote Sensing Activities
Image processing of the remote sensing images of the Rio Branco area gives students a chance to get some real "hands-on" experience and to come to know the area well. The activities are written assuming the students know some of the basics of image processing (IP): importing files, what a gray-scale image is, etc. For students unfamiliar with IP, there are hot-links within the activities to existing training activities. Herein lies an important trade-off for you, the teacher: using IP involves the students much more deeply in the learning process and gives them "ownership" of the IP products and their results. However, learning IP takes some time. From experience, we find that many students pick up IP quickly, but to learn the skills required in these activities will take several class periods.

Note: Software Requirements: Macintosh users must download NIH Image. (Instructions for Windows users are currently under construction.)

For classes 1) with no access to NIH Image, or 2) insufficient time to learn basic IP, processed images for each of the activities requiring processing are also included in this teacher's section. Using the processed images plus the images in the student module primarily intended for inspection only, students can obtain nearly all of the information relevant to the rainforest module by simply downloading and carefully inspecting the images.

Seeing Environmental Change
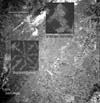
From inspection of the full-scale images, the enlarged sections shown on the "Brazil Finder map," and the color composites given below, students should be able to recognize

1. roads (bright line with striaght sections in Area CE)
2.
rivers (medium to britht irregularly curving lines in Area C)
3.
oxbow lake (medium gray horseshoe-shaped areas in Area CW)
4.
ranches (large bright polygonal areas in Area NC)
5.
small farms (small irregular bright areas in Area NE)
6.
clouds (brilliant blue-white patches in the true color composite), and
7.
the jungle itself (green in the 3-2-1 true color composites, red in the 5-3-2 near-IR color composites).

Differences in the apearance of vegetation in Rain Forest 4-5-7 are partially due to the variety of plants and partially due to differences in the availability of water. Note the prominence of stream courses.

Here are some color composites:

Image of a true color composite made from Brazil 1-3, 1-2, and 1-1.

Image of a IR composite made from Brazil 1-5, 1-3, and 1-2.

First, the true color composite made from Brazil 1-3, 1-2, and 1-1.

Notice the deep green of the old forest, the lighter greens and browns of the open fields, the tan of the city, and the blue-white clouds.

Second, the IR composite made from Brazil 1-5, 1-3, and 1-2.

Notice the deep red of the forest and the lighter reds and tans of the farms and ranches.


The changes between the 1986 and 1992 images are obvious. The increase in area of the large ranches, the small farms, and the city of Rio Branco is significant. Note the decrease in dark vegetative cover in Area CE. Note also that the cloud patterns are different between the two dates, which can be confusing to students unless they recognize the clouds for what they are. The best way to see the differences is to animate or flicker between Brazil 1-2 and 2-2, or to place them side by side on the computer monitor screen. Another way is to ratio them, in which case an image like this one will be obtained:

Image of a false-color rendition. In this false-color rendition, the 1986 agricultural areas are colored red and yellow, while the 1992 areas are dark blue. Note that the same color scheme applies to the 1986 and 1992 clouds.

Notice that the farms and ranches have been built outward from the roads and pre-existing open areas so that farmers could avoid the difficulty of traveling through virgin rainforest. One can assume that the greatest growth in the near future will be outward from the existing open areas.


Measuring Environmental Change
Linear and area measurements on Brazil 1-2 and 2-2 can be made on the computer using NIH Image or from printed copies of these images. The width of the imaged area is 185 kilometers. The most likely location for a biodiversity preserve or national park is in the large untouched area at lower left center of Brazil 2-2, NW of Xapuri. As the students should find from the Brazil Remote Sensing web site, rubber trees are found along the river south of Rio Branco. The political seat of the rubber tappers is Xapuri in the south, so the migratory rubber tappers themselves will tend to be between Rio Branco and Xapuri.

The increase in agricultural area between the two images can be measured fairly easily using the density slice command as described in the student section. The two images below show how Brazil 1-2 and 2-2 will appear with the appropriate density slice applied.

Image of a agricultural area that is being measured by the density slice command.

Image of another agricultural area that is being measured by the density slice command.

Each image has pixels highlighted in red and squares outlined in green and blue. The location of the squares is the same (to the pixel) in each image. The sizes of the squares were chosen to make calculation of the areas simple. The Analyze/Measure command will calculate the area of the highlighted (red) pixels within the selected square. The results from measurement on these squares are;

Image

Area of
Square, km2

Highlighted
Area, km2

% of
Area

1-2

10,000 (blue)

644

6.4

1-2

22,500 (green)

1742

7.7

2-2

10,000 (blue)

1281

12.8

2-2

22,500 (green)

3512

15.6


The difference in percent areas between the blue square and the green square in the same image is simply due to each square's size and location. Obviously the percentages are not exact. Students should get similar values unless they choose small squares centered on Rio Branco or in the middle of the rain forest. Students should be encouraged to pick a square representative of the whole image (ignoring the clouds). Note that the red pixels in the middle of the forest at lower left in each image are due to lighting changes across the image, not to farms.

As seen from the measurements in the table above, the increase in area of the developed lands is about a factor of 2 in just 6 years. While this may seem unrealistically large, this increase can be compared with increases in other areas in Brazil given in the Brazil Remote Sensing web site. The changes can also be compared with the increase in population of Rio Branco and the state of Acre of which Rio Branco is the capital:

Popuation Changes
Year Acre Rio Branco
1960 160,000
1970 218,000 34,531
1980 301,605 87,462
1990 437,419
1991

313,000 (estimated)

Finally, the sizes of Brazilian ranches and farms can be compared with the sizes of American farms and ranches using:

Image of a scaled and pasted Brazilian section. The scaled and pasted Brazilian sections are Areas NC 2 (large ranches) and NE 2 (small farms). As can be seen from the image, the Brazilian ranches are typically ten times larger in area than the American farms, and the small Brazilian farms are about ten times smaller. You might suggest that students think about what the difference in the sizes of farms and ranches in Brazil implies about the wealth of farmers verses ranchers, and how the difference might affect local politics.


Preparation Checklist--have you thought of everything?

Button that takes you to the Mars Landing page.
Button that takes you to the Strangers in Paradise page.
Button that takes you to the Severe Weather Events page.
Button that takes you to the Weather or Not page.
Button that takes you to the Yellowstone Fires page.
Button that takes you to the Coral Reefs page.Button that takes you to the El Nino: The Child Returns page.
Button that takes you to the Florida Everglades page.
Button that takes you to the Global Climate Change page.
Button that takes you to the Korean Enigma page.
Button that takes you to the Mountain Gorillas page.
Button that takes you to the Rift Valley Fever page.
Button that takes you to the Temperate Rainforest page.
Image that says Tropical Poison.
Button that takes you to the Volcanoes page.
Button that takes you to the Water Quality page.
Button that takes you to the Earth on Fire page.
Button that takes you to the UV Menace page.

Grade Level: 7-12

Providing for Reflection
Despite a limited level of commitment while working on a module, students can still experience significant learning if they enter into the reflection process. Ideally, reflection occurs at various points during the module; however, reflection done only at the close of a module can also be a powerful learning experience.


Button that takes you to the teacher pages. Button that takes you to the modules and activities page. Button that takes you to the main Exploring the Environment page.
   
 
Last updated April 28, 2005
   

HTML code by Chris Kreger
Maintained by ETE Team

Some images © 2004 www.clipart.com

Privacy Statement and Copyright © 1997-2004 by Wheeling Jesuit University/NASA-supported Classroom of the Future. All rights reserved.

Center for Educational Technologies, Circuit Board/Apple graphic logo, and COTF Classroom of the Future logo are registered trademarks of Wheeling Jesuit University.