
![]()
![]()
![]()
Water
Quality Assessment: Physical: Elevation and Catchment Area
Elevation and catchment
area of a watershed can be obtained
from topographic maps of the sample area. Image:
Topographic map of Wheeling, WV. Image courtesy of USGS
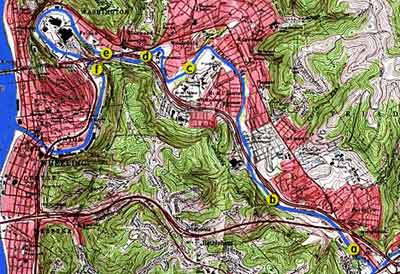
Elevation information is printed directly on topographic maps. The investigator need only find the location of the site and read the corresponding elevation. Catchment area can be measured on a topographic map using a planimeter. A planimeter is a piece of clear plastic covered with evenly-spaced dots. The investigator places the planimeter on the topographic map and counts the number of dots that lie within the watershed's boundaries. Planimeters are calibrated so that one can calculate the area (km2) of the watershed from the number of planimeter dots that cover it.
Overview ..|.. Biological Assessment ..|.. Chemical Assessment ..|.. Physical Assessment.
Elevation
and Catchment Area / Stream Order / Forest
Canopy / Width, Depth, and Velocity
/ Rock Size / Turbidity
/ Total Solids / Temperature Home
..|..
Teacher Pages
..|..
Modules
& Activities
Glossary .|.
Related Links
.|..
References
..|..
PBL Model
.|
HTML code by Chris Kreger
Maintained by ETE Team
Last updated November 10, 2004
Some images © 2004 www.clipart.com
Privacy Statement and Copyright © 1997-2004 by Wheeling Jesuit University/NASA-supported Classroom of the Future. All rights reserved.
Center for Educational Technologies, Circuit Board/Apple graphic logo, and COTF Classroom of the Future logo are registered trademarks of Wheeling Jesuit University.